The nose is the primary entry point for respiratory infections (hence rhinoviruses). This is because most of the air you breathe enters through here. The nose has a host of defenses, including the physical barrier of mucus (which also contains antibodies and peptidases) and the production of nitric oxide, a potent antimicrobial.
The other major entrypoint is the mouth, which has its own defenses including proteases and antibodies in saliva and the fact you can swallow viruses, yet mouth breathing is a significant risk factor for respiratory infections in children.
Respiratory infections are not treated as seriously as they should be. The flu causes tens of thousands of deaths per year in the US and costs tens or hundreds of billions a year; RSV is the leading cause of infant hospitalizations; long COVID affects millions and globally costs an estimated $1T annually; TB remains one of the world's deadliest infectious agents. Even the "common cold", which is actually infection by any of 200 or so viruses, can cause severe complications like pneumonia.
We are increasingly recognizing the accumulated burden of frequent infections, including connections to Alzheimer's and other neurological diseases, and the profound neurological benefits of vaccination, like the huge relative risks in this 2025 paper from Maggi et al.:
Vaccination against herpes zoster was associated with a reduced risk of any dementia (RR 0.76, 95% CI 0.69–0.83) and Alzheimer’s disease (RR 0.53, 95% CI 0.44–0.64). Influenza vaccination was linked to a reduction in dementia risk (RR 0.87, 95% CI 0.77–0.99), as was pneumococcal vaccination (RR 0.64, 95% CI 0.47–0.87) for Alzheimer’s disease. Tetanus, diphtheria, pertussis (Tdap) vaccination was also associated with a significant reduction for any dementia (RR 0.67, 95% CI 0.54–0.83).
We should not be surprised if today's viral load is damaging. The variety and frequency of infections we are now subjected to is an unnatural state for humans; as a species, we are accustomed to living in small tribes with no international travel.
By coincidence, just this week, Stripe launched the Intercept project, "a $500M philanthropic initiative to make respiratory infections, like the common cold and flu, a thing of the past" so at least some people are starting to take the problem seriously.
Nose sprays
This brings me on to one of my favorite subjects: nose sprays! Preventing infectious disease is one of the easiest way to improve long-term health and longevity. Luckily, nose sprays are a pretty simple, inexpensive, and effective intervention. These sprays primarily act outside of your cells, so the risks compared to e.g., antibiotics, are very low.
There are two major types of nose spray: those that act as a physical barrier to prevent entry of viruses, and the more drug-like antimicrobial or antihistamine sprays. The fact that most of the studies below are COVID-specific is just because of the timing of the pandemic and associated funding.
Physical barrier
- Salinex and LUCA V-Defense are carrageenan-based sprays with evidence for COVID infection prevention. $20 per bottle
- Profi is a gellan/pectin-based spray with evidence for influenza infection prevention in mice. $25 per bottle.
- Xlear is a xylitol-based spray with weak evidence as a COVID treatment. $33 per bottle
Antimicrobial / antihistamine
- NOWONDER is a nitric oxide spray with evidence for treating mild COVID. $40 per bottle.
- ViralDine is a povidone iodine spray with evidence for COVID inactivation. $20 per bottle.
- AstePro is an antihistamine spray with evidence for COVID infection prevention. $18 per bottle
Surprisingly, many of the papers above show pretty good evidence. Like masks, the mechanisms of action here are very straightforward.
My personal preference is for the physical barrier sprays. They act as an additional barrier like sunscreen, and appear to be very safe. For example, carrageenan is a GRAS food additive, sometimes used as a vegan alternative to gelatin.
Arguably, the successor to carrageenan sprays is Profi, which essentially builds on the "augmented mucus" concept. Profi has two main advantages over carrageenan: it provides both a physical barrier and pathogen neutralization, and it lasts a claimed eight hours. In 2024, the two professors at Harvard behind Profi published an intriguing study showing complete protection from Influenza A in a mouse model.
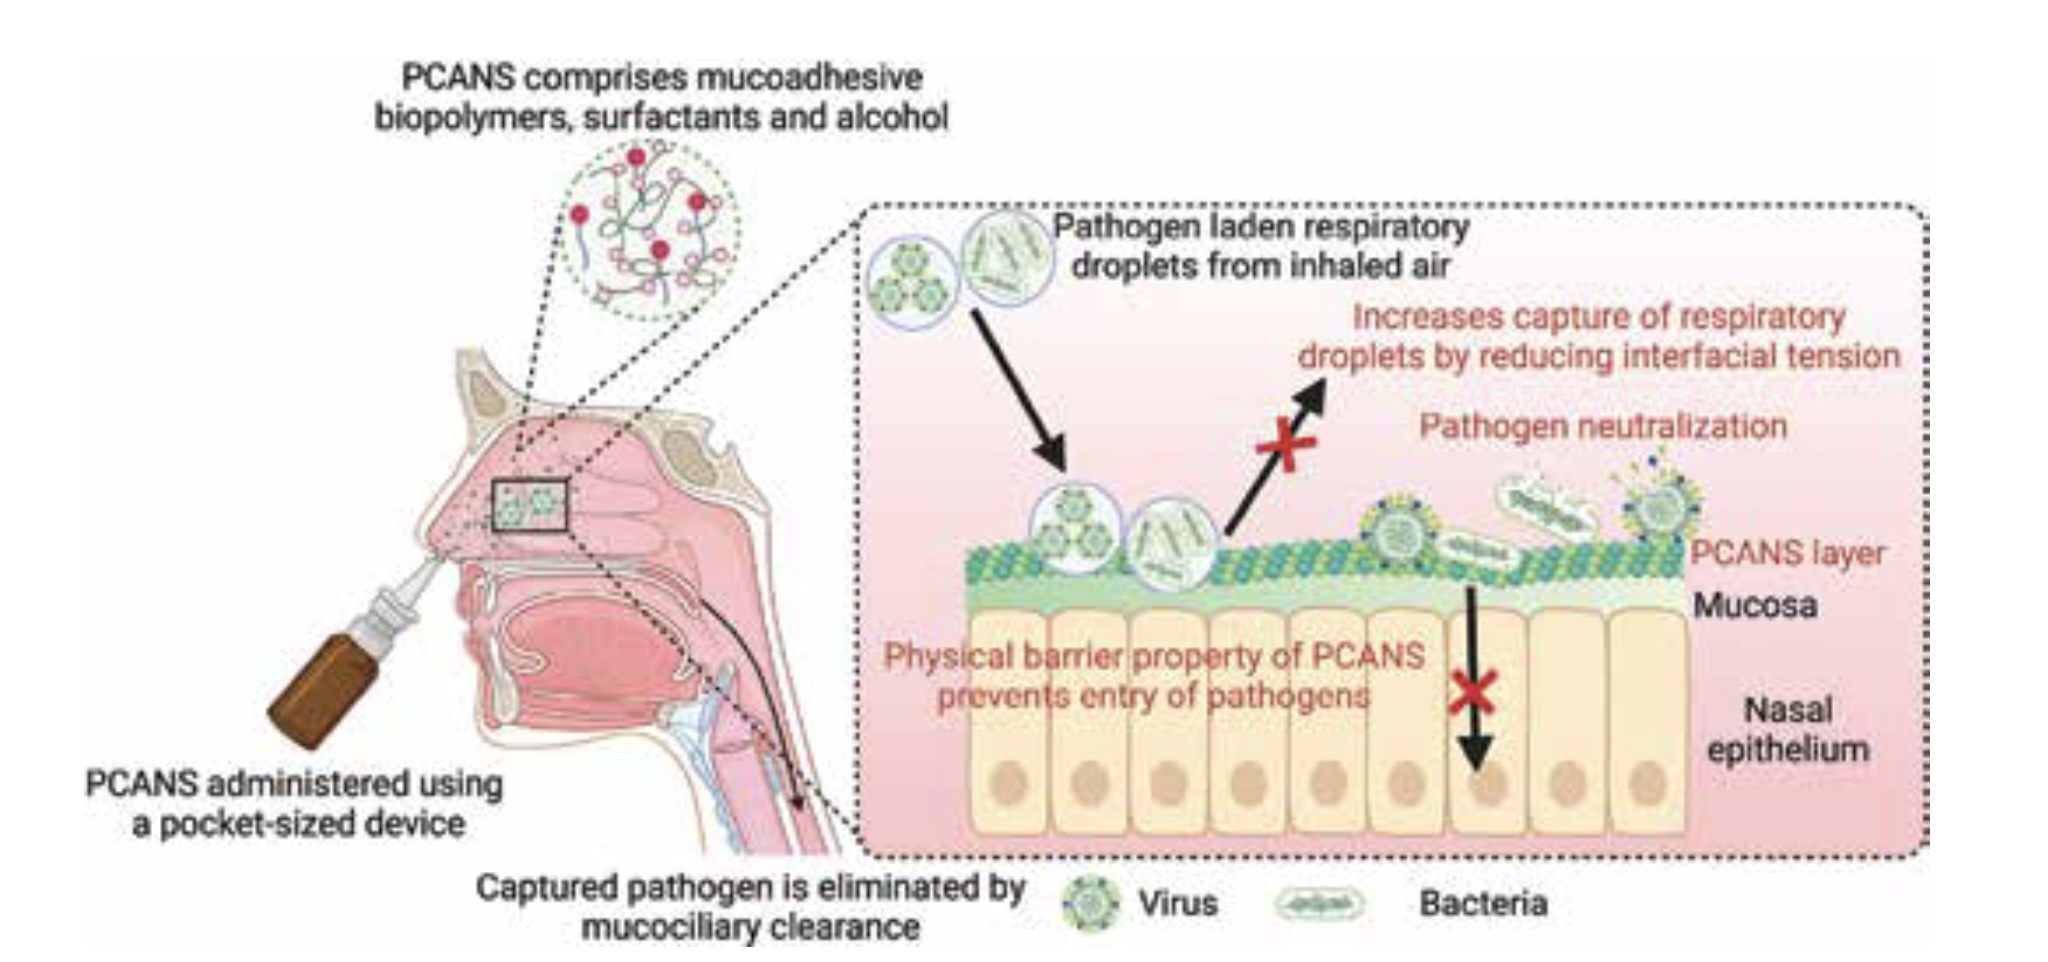 Profi acts as a physical barrier and neutralizes pathogens
I currently use Profi a maximum of once per day, but for more protection I would probably recommend Profi in the morning, and maybe NOWONDER nitric oxide spray before bed.
The alternatives
Good evidence and real papers are the exception in the supplement/wellness space. Maybe the nuttiest example is Oscillococcinum, which is somehow both homeopathic and snake oil, yet still gets sold in supermarkets all over the US and Europe.
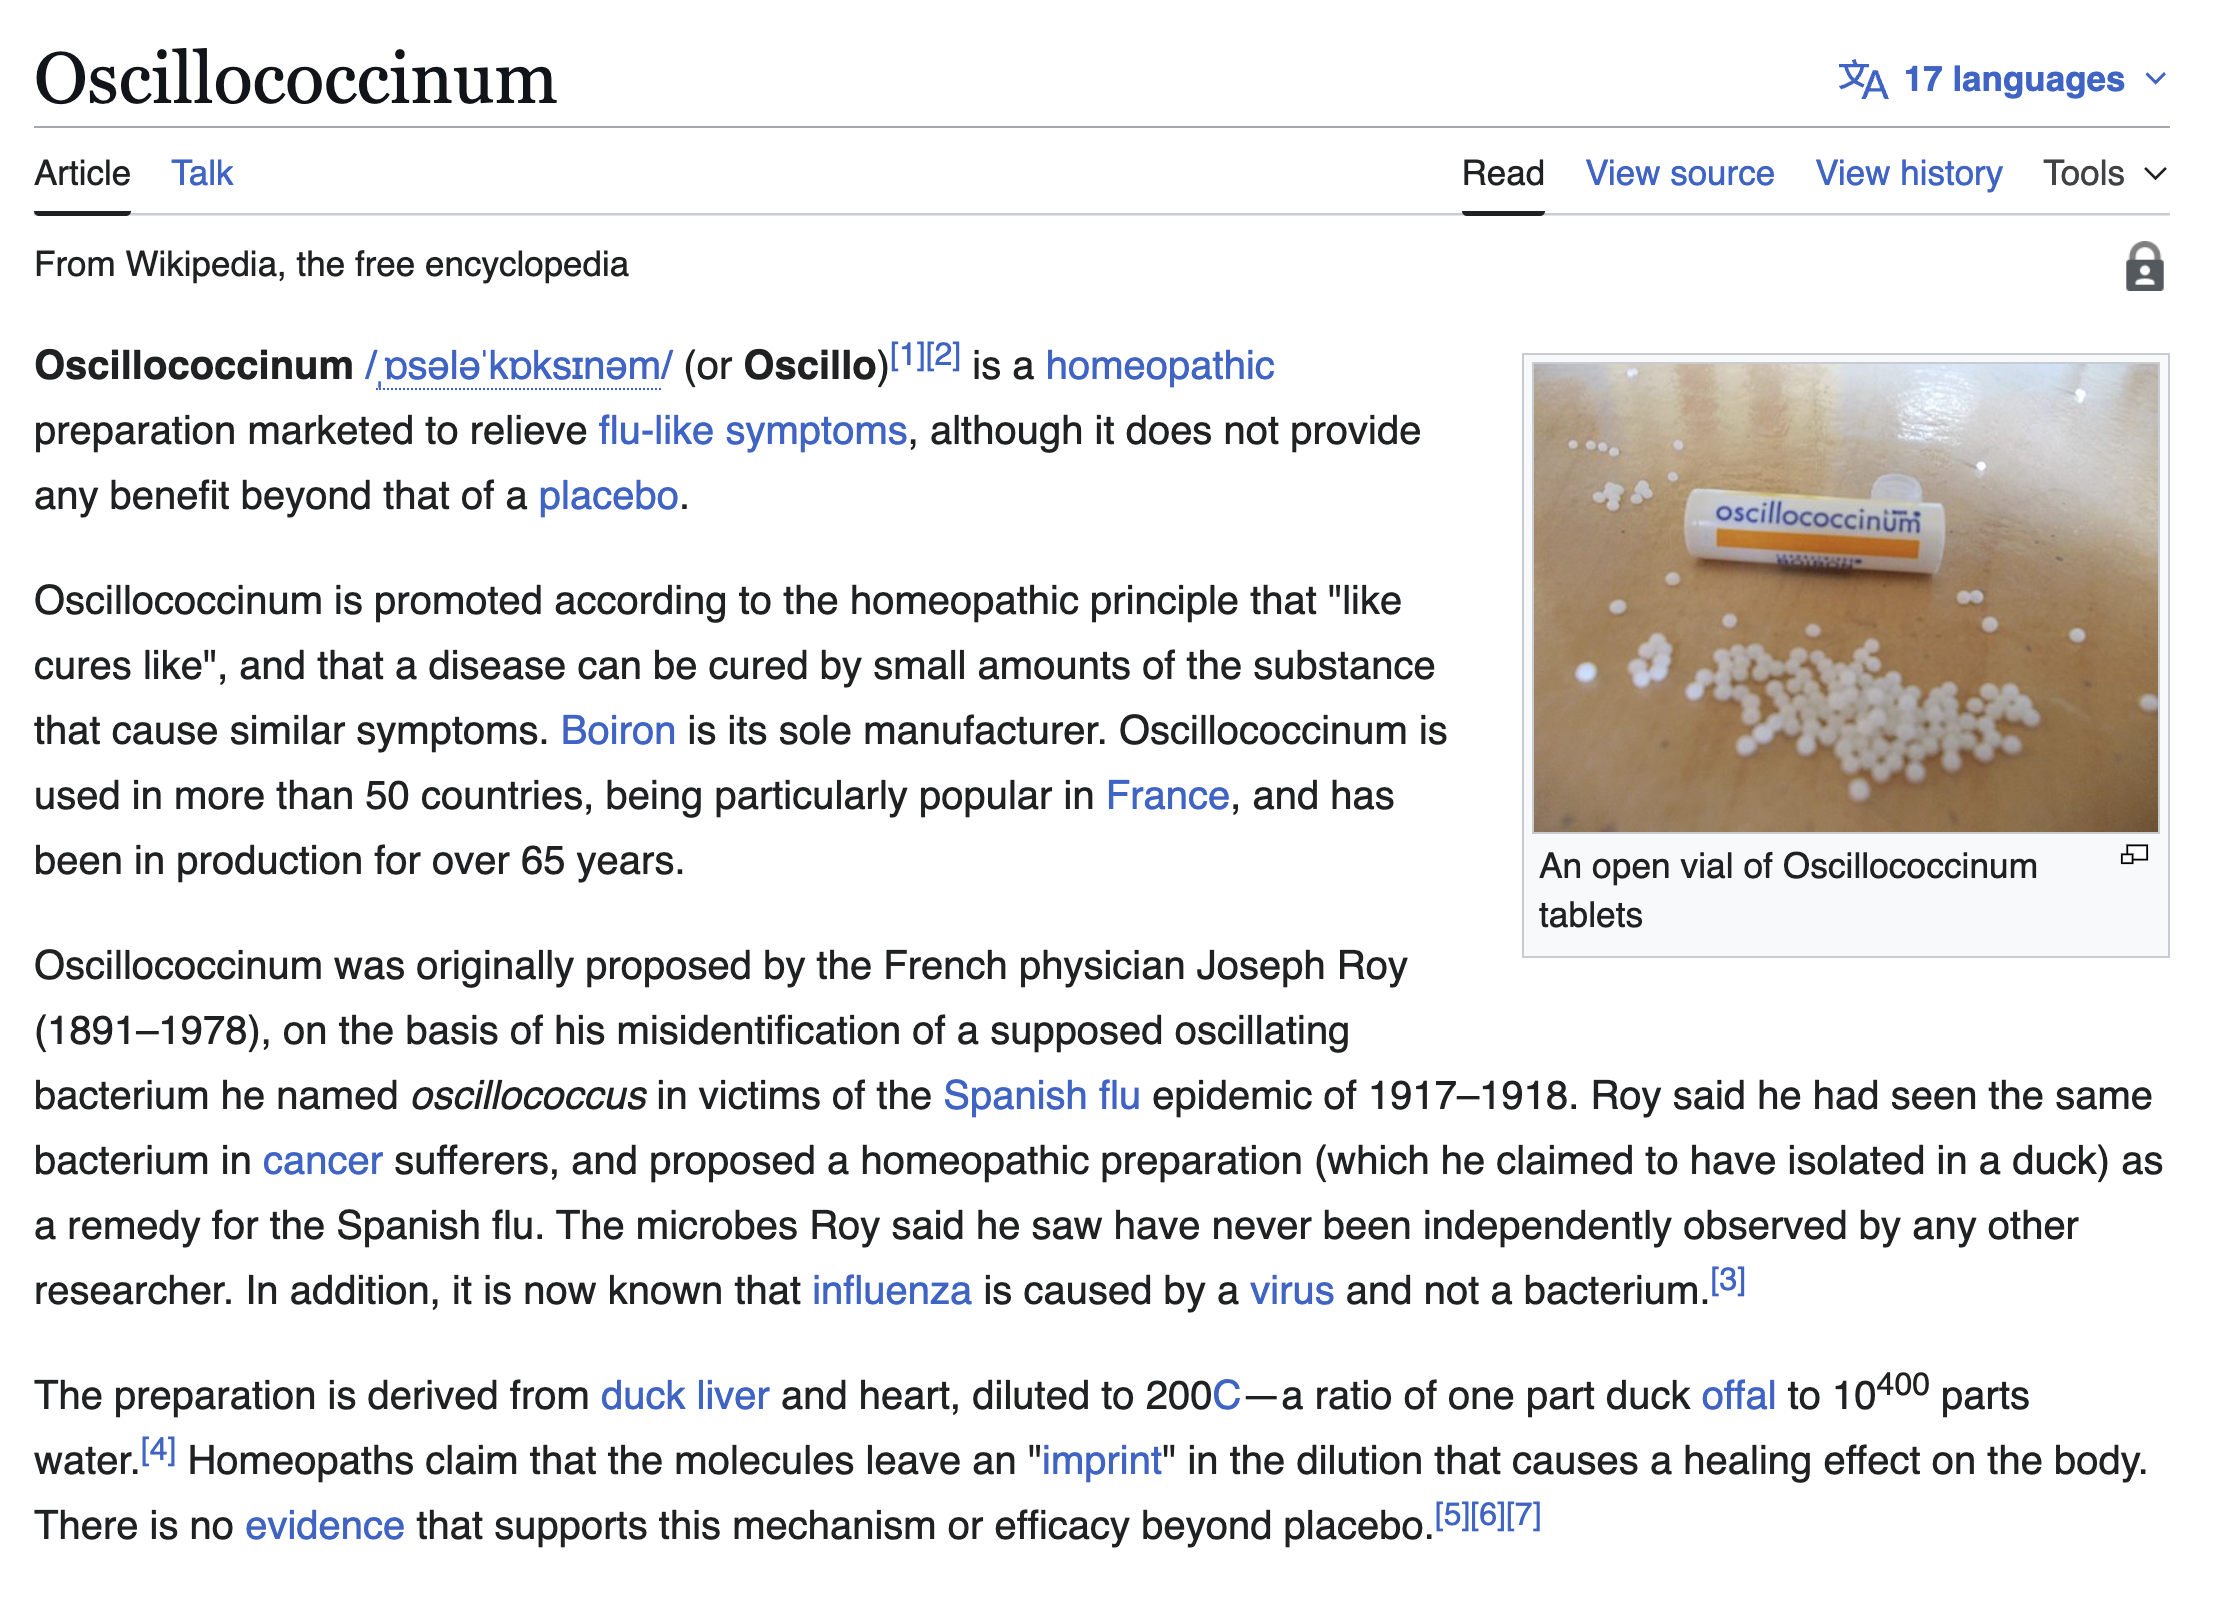 Despite its insane ingredients, Oscillococcinum had revenue of $15M/yr in the US in 2008
Zicam, a nose spray you can find everywhere for "cold and allergy relief" appears to be exploiting the homeopathy loophole too. The evidence in its favor is weak, and there are hundreds of lawsuits filed against the company, alleging loss of sense of smell.
 Despite weak evidence and potential anosmia, Zicam has revenue of approximately $100M/yr
A viral infection case study
The children sometimes get respiratory infections at school. The last time this happened was a couple of months ago, and I decided to sequence some saliva to see what the infectious agent was.
Many of the likely culprits are RNA viruses, so sadly you can't just do DNA sequencing, you need to do metatranscriptome sequencing.
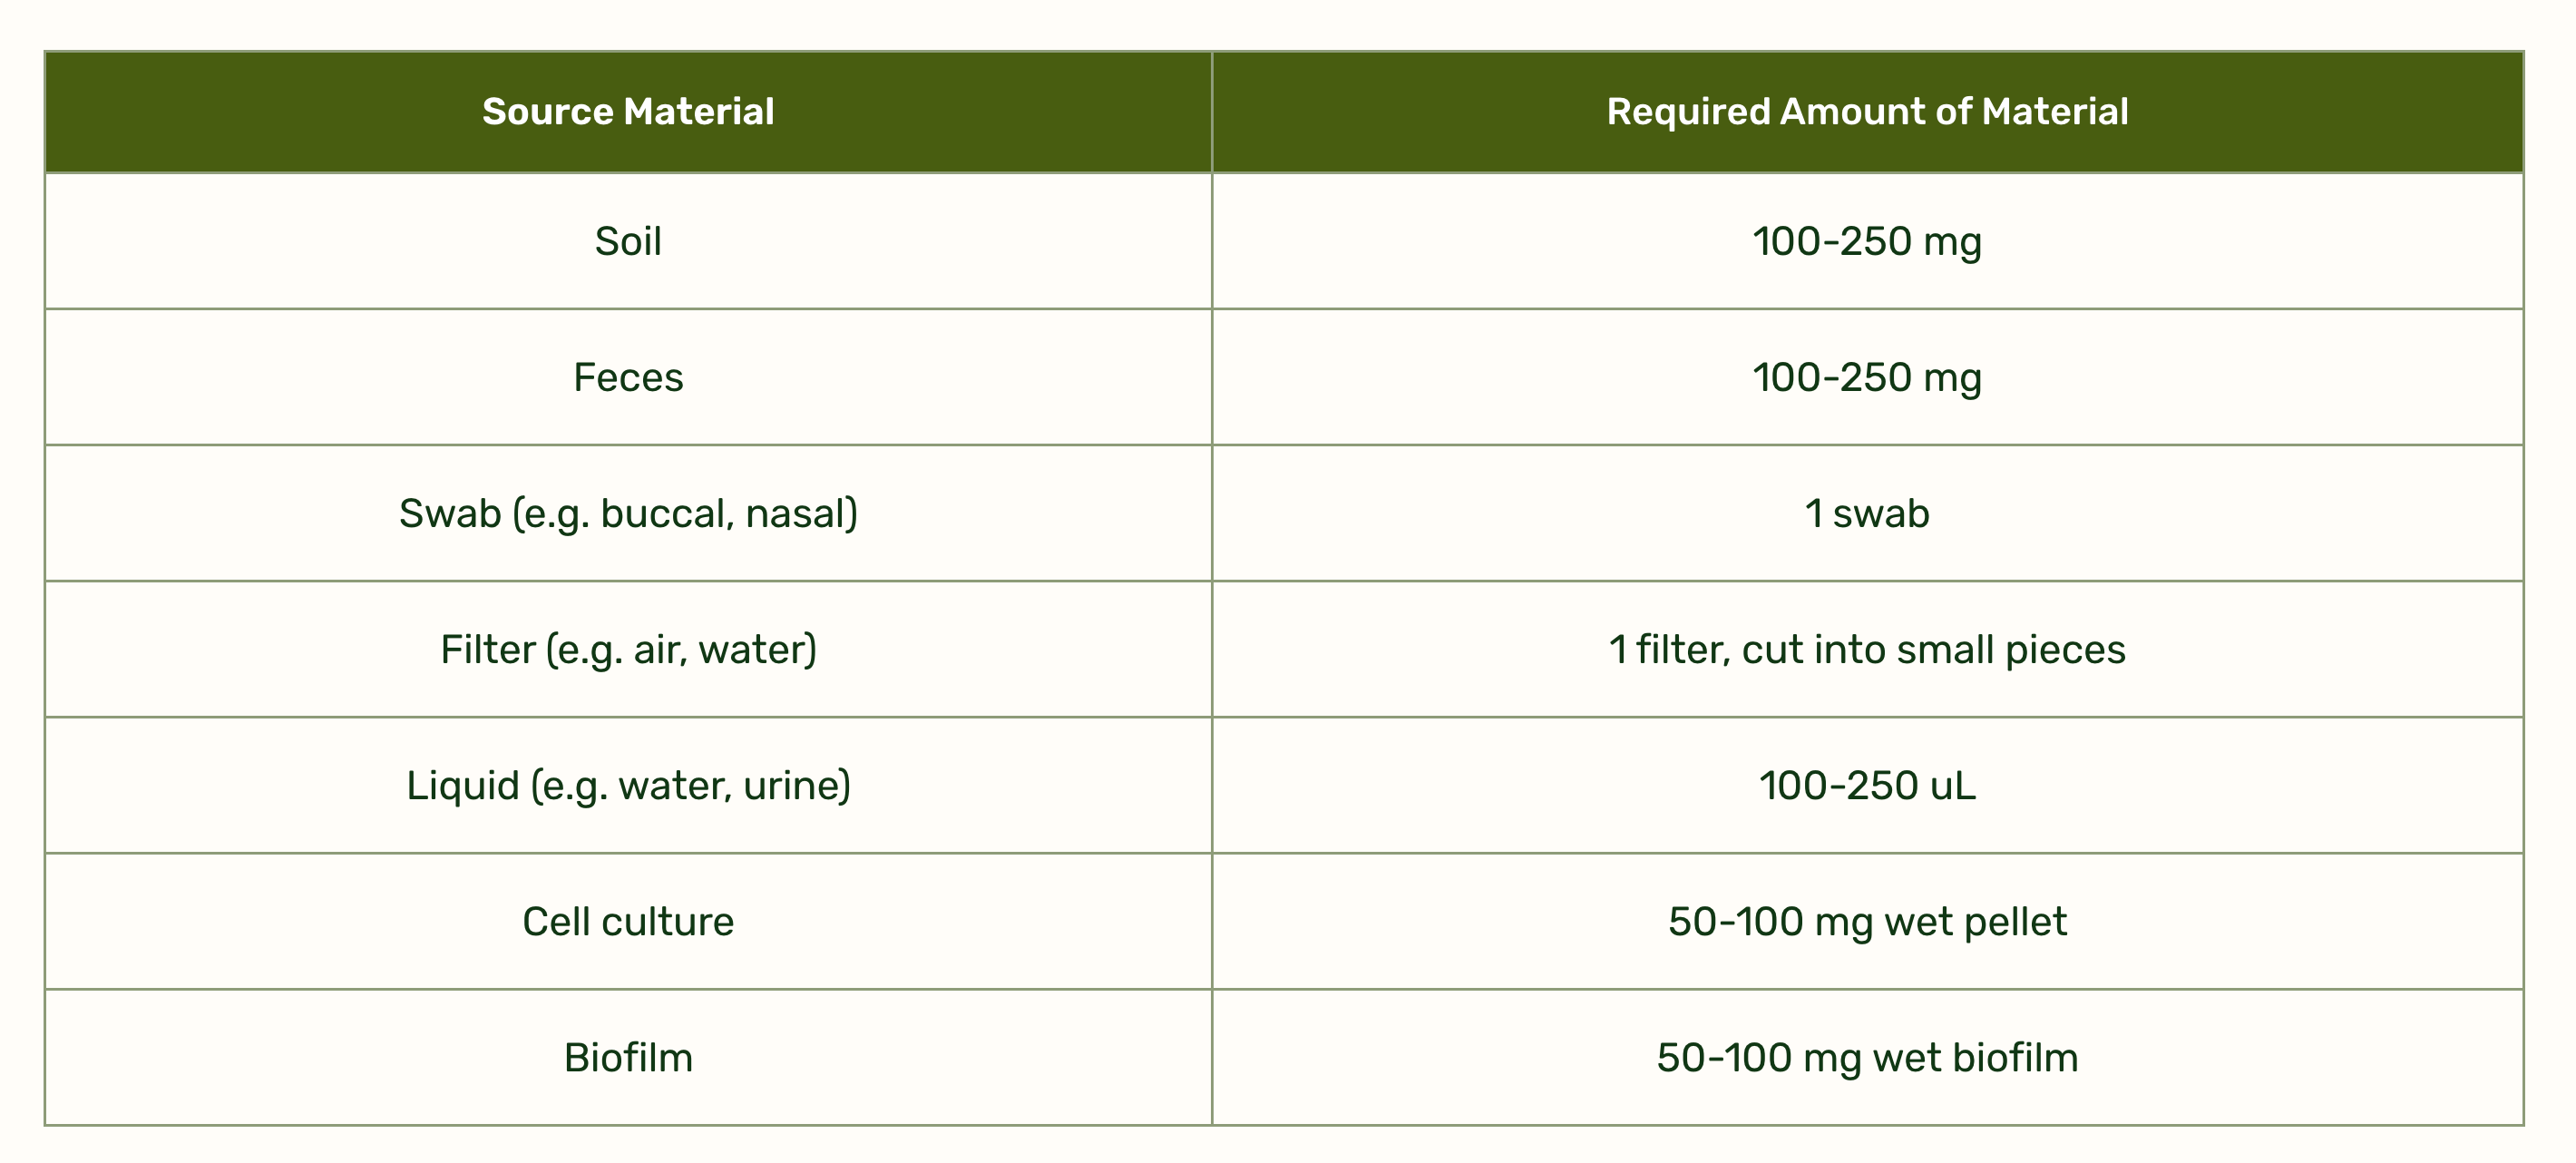
Zymo has a great service where they will do 30 million paired end reads of metatranscriptomic sequencing for $375 from an unprocessed sample (e.g., saliva).

Zymo is very amenable to small projects, and processed my single sample. I did need Zymo DNA/RNA shield ($74) to stabilize the RNA, but I had some from a previous project. The sequencing took around six weeks, and the results look exceptionally clean.
Metatranscriptomic results
The metatranscriptomic analysis found a normal, healthy distribution of bacteria.
Top bacterial species
| Species | Abundance | Phylum | Seq identity | Genome coverage | |
|---|---|---|---|---|---|
| Porphyromonas pasteri | 8.5% | Bacteroidota | 97.4% | 93% | |
| Rothia mucilaginosa | 5.8% | Actinobacteriota | 98.4% | 79% | |
| Rothia sp001808955 | 2.8% | Actinobacteriota | 98.1% | 56% | |
| Alloprevotella sp015257125 | 2.6% | Bacteroidota | 97.8% | 89% | |
| Prevotella melaninogenica | 2.2% | Bacteroidota | 98.4% | 71% | |
| Actinomyces graevenitzii | 2.2% | Actinobacteriota | 97.1% | 78% | |
| Rothia sp015265375 | 2.2% | Actinobacteriota | 98.2% | 47% | |
| Rothia mucilaginosa_B | 2.2% | Actinobacteriota | 98.2% | 47% | |
| Capnocytophaga gingivalis | 1.8% | Bacteroidota | 97.5% | 75% | |
| Neisseria perflava | 1.5% | Proteobacteria | 98.8% | 58% | |
| Streptococcus mitis_BB | 1.4% | Firmicutes | 99.0% | 51% | |
| Alloprevotella sp900095835 | 1.4% | Bacteroidota | 98.3% | 79% | |
| Bulleidia sp015256775 | 1.4% | Firmicutes | 98.1% | 84% | |
| Rothia aeria | 1.3% | Actinobacteriota | 98.3% | 86% | |
| Gemella sanguinis | 1.1% | Firmicutes | 97.9% | 75% |
Top viral species
| Virus | Abundance | Note | |
|---|---|---|---|
| Tomato brown rugose fruit virus | 64% | dietary plant virus (tobamovirus) | |
| uncultured phage | 27% | bacteriophage | |
| Human metapneumovirus (HMPV) | 9% | real respiratory pathogen → target |
The tobamovirus hit is probably from recently eaten food. There is only one human virus in the dataset: human metapneumovirus (HMPV). HMPV is a single-stranded RNA virus with a lipid coat that is one of the most common causes of the common cold. There is no antiviral treatment for HMPV. Like most viruses, the advice is to wait for your immune system to fight it off.
HMPV is usually not serious in older children or adults, but accounts for 5% to 10% of hospitalizations among pediatric patients with acute respiratory tract infections.
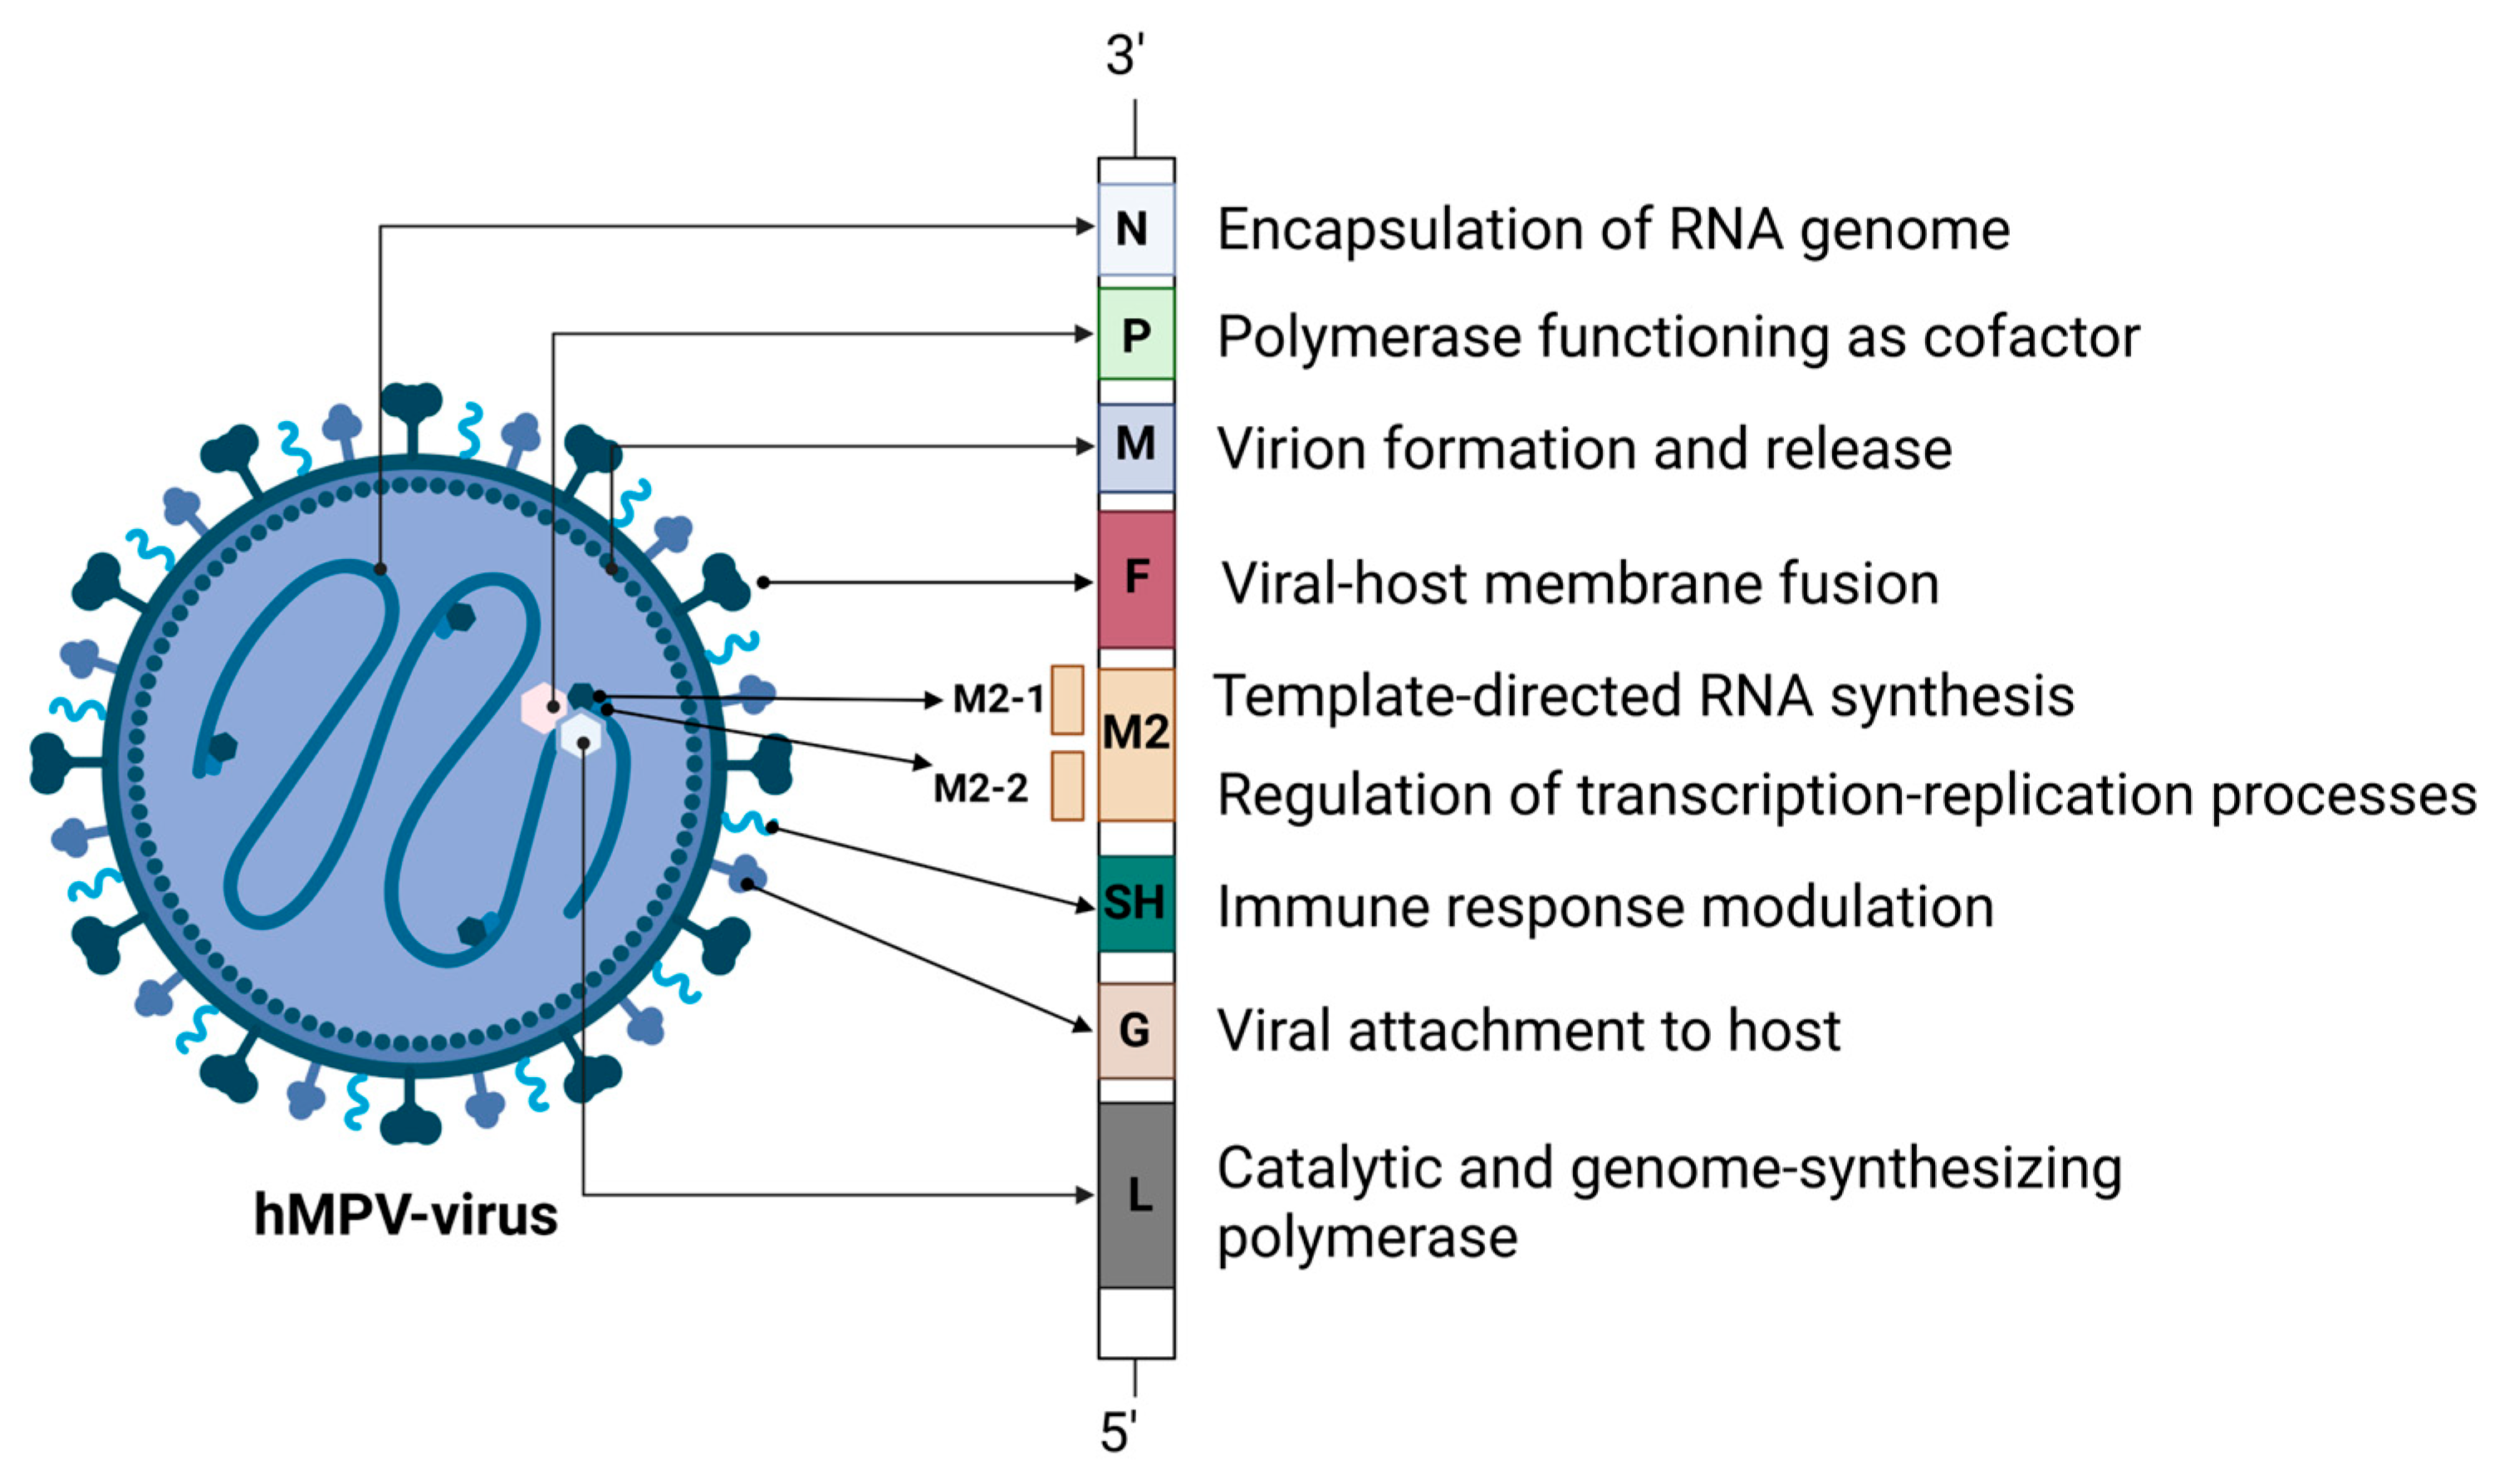 Diagram of HMPV from Lianou et al., 2025
Virus sequence
The sequence of the genome is about 3% diverged from the closest reference (FJ168778.1), with 64 missense mutations. It's not that surprising that it all matches a reference sequence so well, but it's still gratifying to see.
 The sequence of my HMPV vs a reference sequence
Virus structure
The structure of the HMPV virus is way bigger and more complicated than you would think from the diagram above.
I am used to thinking of viruses as small icosahedra, with a tightly coiled genome inside (see this great article on icosahedral viruses from Asimov Press).
HMPV is pretty different: it's a coiled nucleoprotein, which requires around 1900 "N" proteins to cover the genome, producing a massive structure of hundreds of megadaltons per virion. All of this is squished into a lipid sphere like a ball of yarn.
I used AlphaFold 3 to fold ten nucleoproteins and some RNA from my virus. As you'd expect, given there are good reference structures in PDB, AlphaFold 3 does a fine job folding the nucleoproteins into a coil. In contrast, the RNA has formed a double-stranded hairpin and does not match the crystal structure.
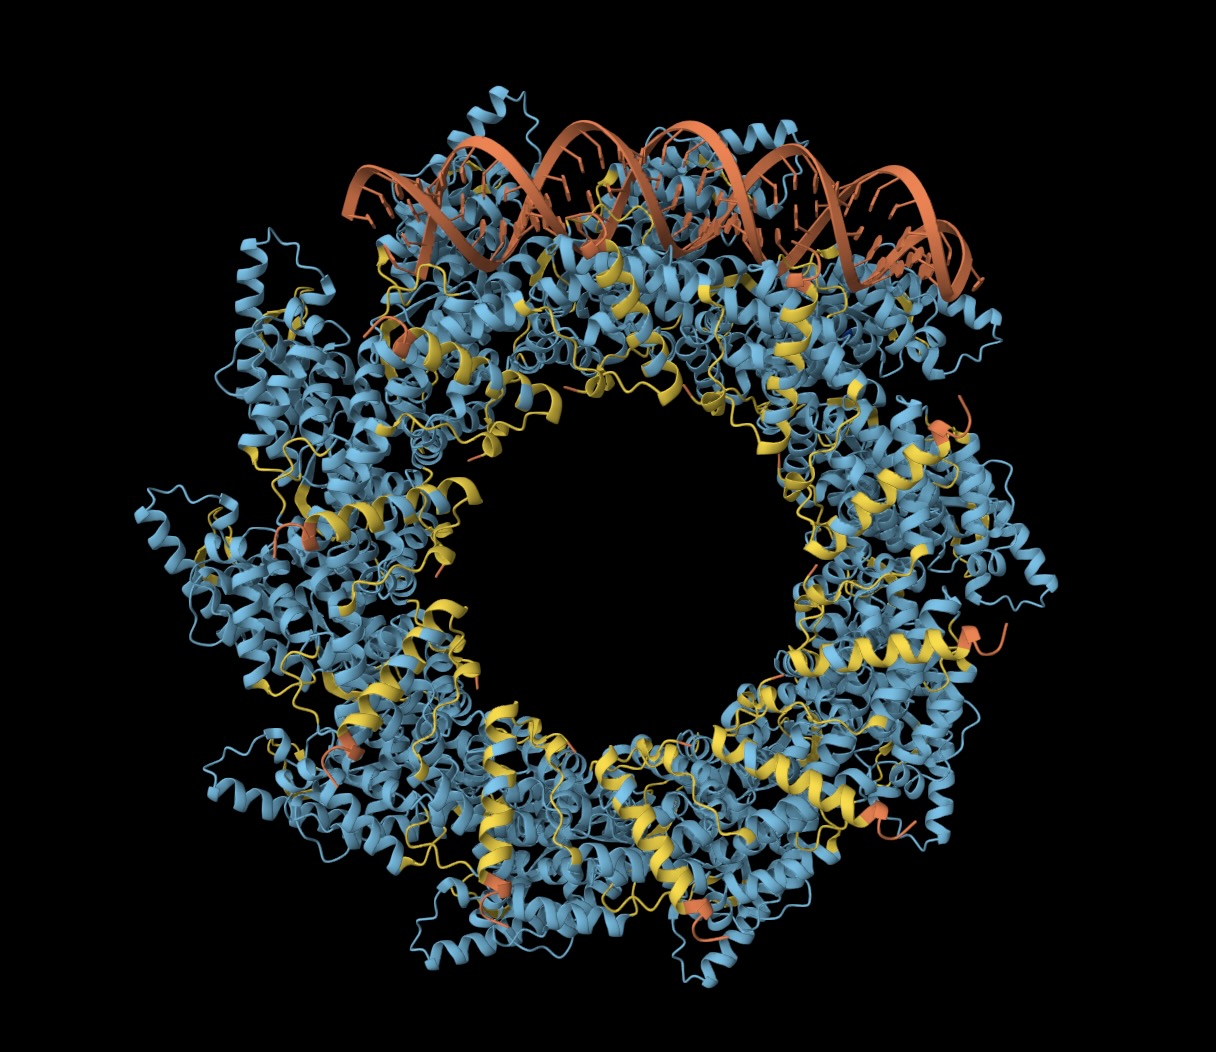
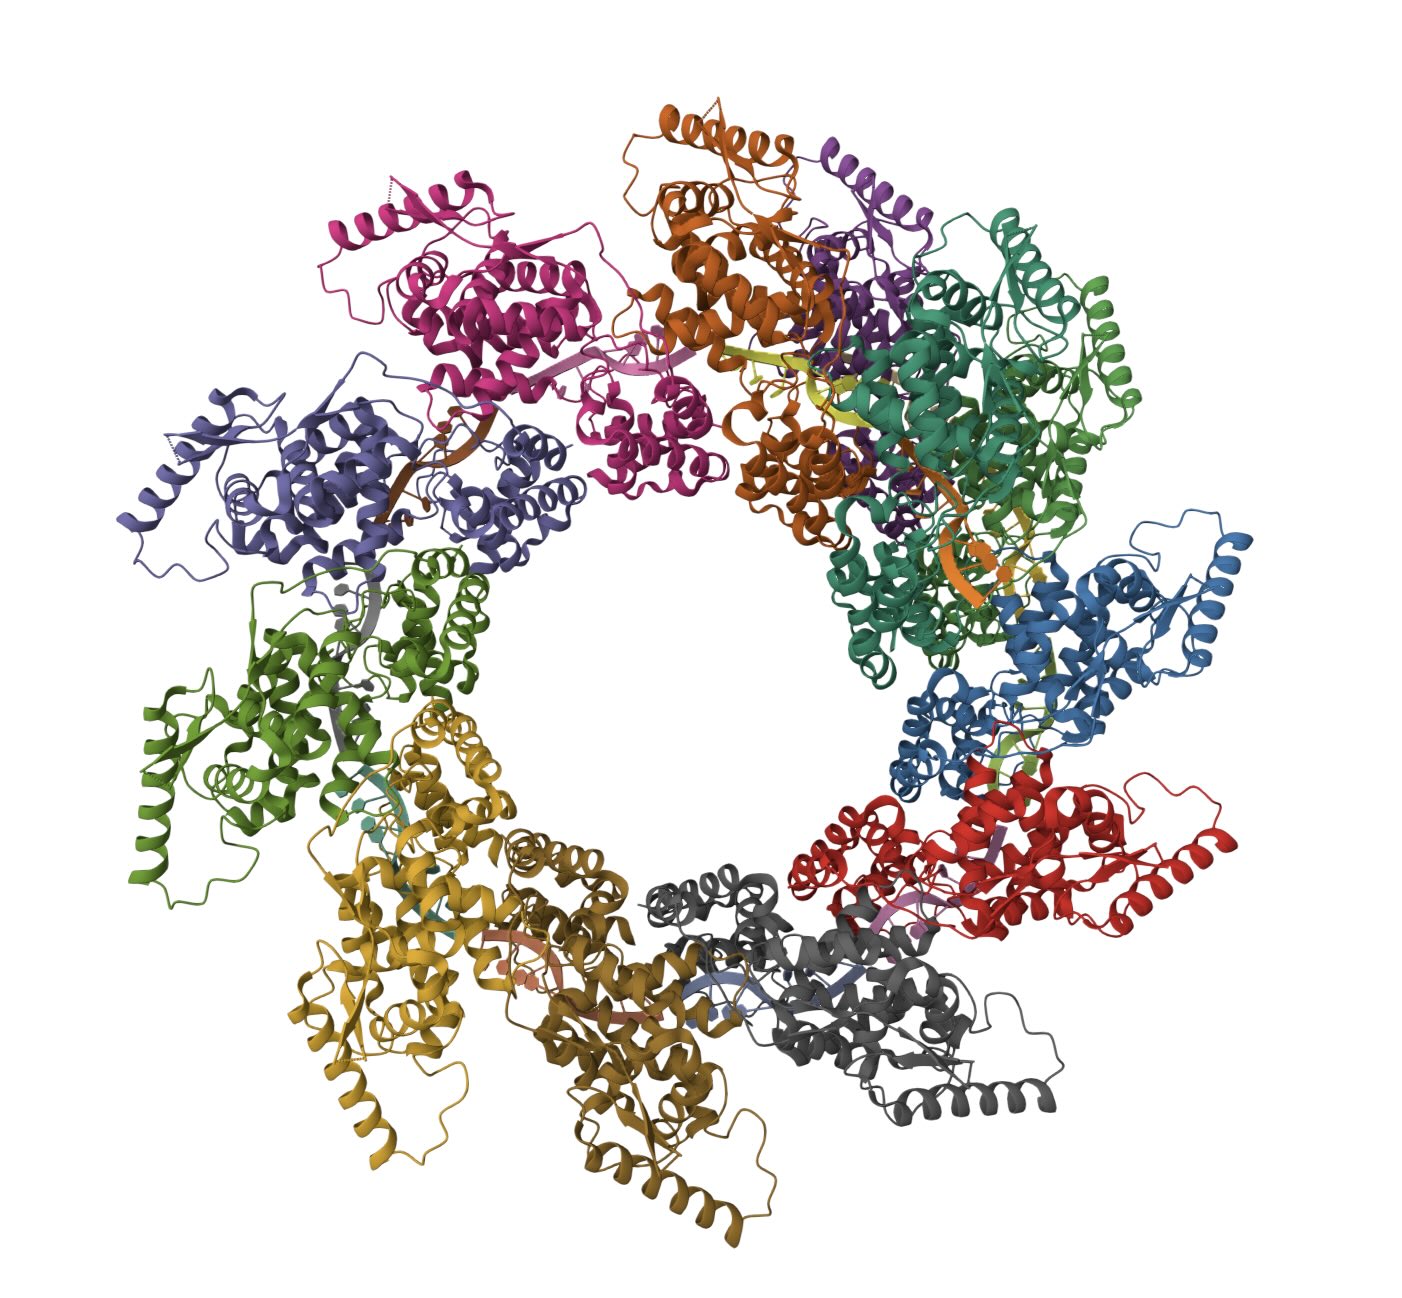
(Left) Ten N proteins from my HMPV in a circular configuration (blue/yellow), with some RNA (orange) wound around. (Right) Eleven N proteins in a spiral configuration (PDB:8PDN)
Viral target
The "F" (Fusion) protein is the obvious target for a therapeutic. It is on the surface of the lipid envelope and mediates cell adhesion and membrane fusion. It has two configurations: pre-fusion and post-fusion. Pre-fusion is the unstable form. When it comes into contact with the host cell, it snaps into the more stable "harpoon" that mediates membrane fusion.
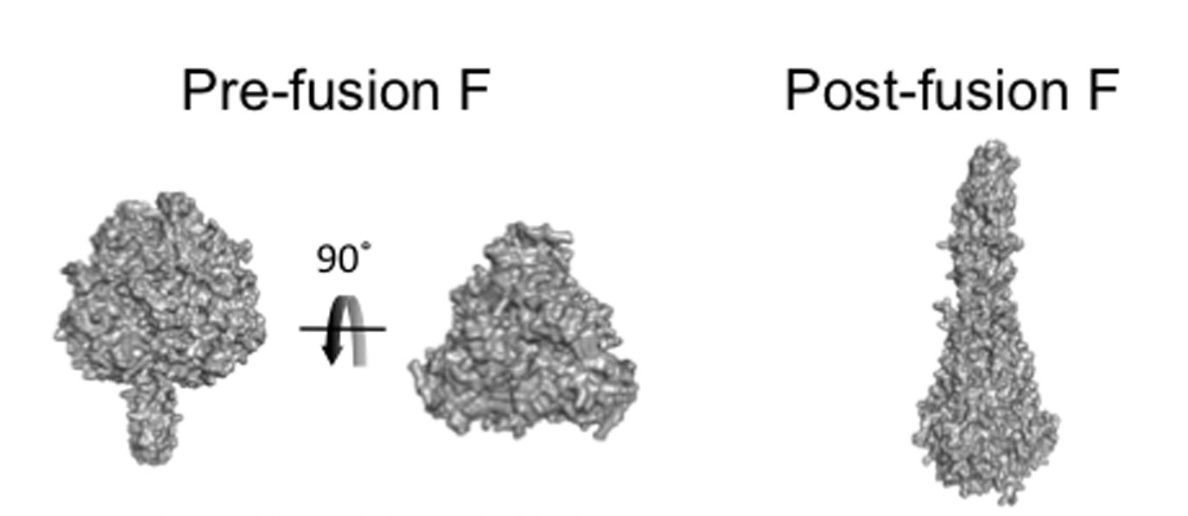 The pre-fusion F protein is compact and the post-fusion F protein is elongated
Luckily, there is a paper (Wen et al., 2012) where the authors created a Fab ("DS7", PDB:4DAG) that binds both the pre-fusion and post-fusion forms. This is the perfect example for us to use as a reference. The sequence of their F protein is 99% similar to ours.
Making a peptide therapy
What if we could design a peptide that binds to the virus and neutralizes it? How hard would that be?
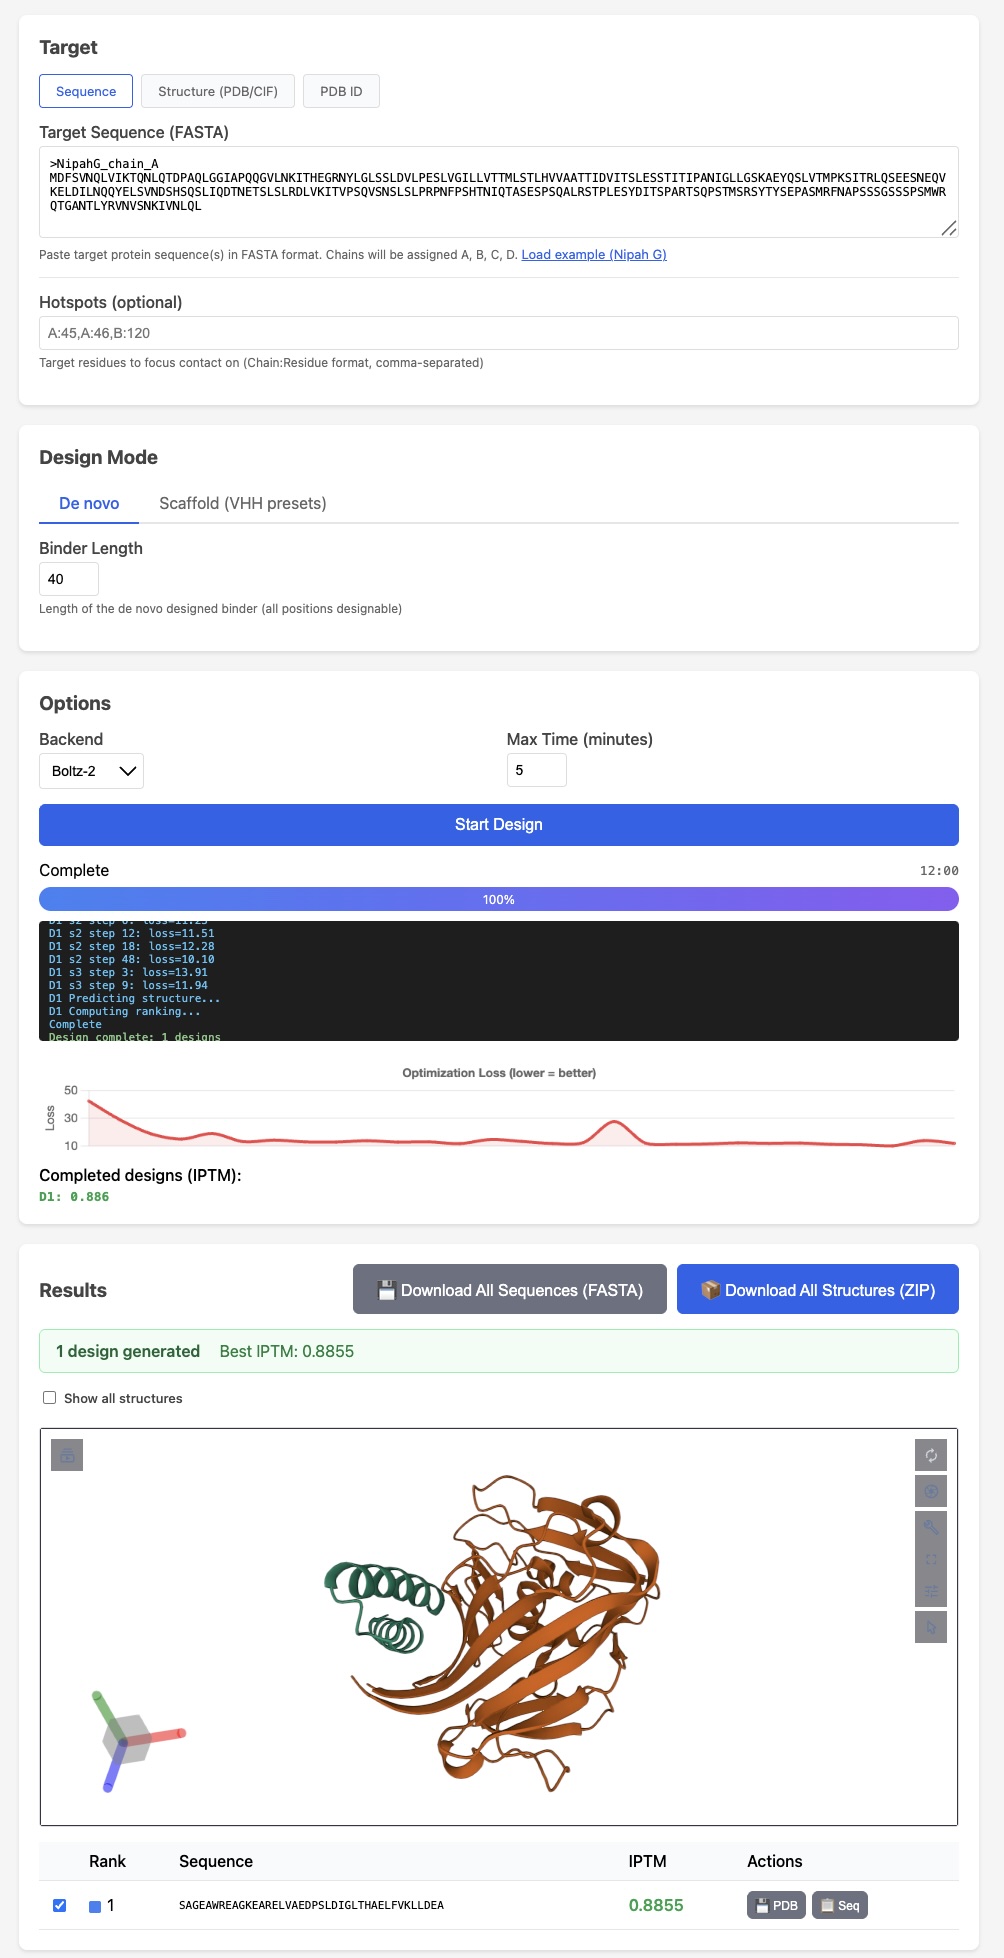
I hear binder design is all the rage these days, so I tried to design a peptide binder. I happened to get some credits for the new BoltzGen API so I decided to try that.
Thanks to the Wen et al. paper, I had a good epitope to go after and a crystal structure of the pre-fusion F protein.
I pointed Claude at the BoltzGen API and asked for a peptide binder of length 20-40, aimed at the DS7 epitope.
I spent around $200 on the BoltzGen API, and came up with a length 28 peptide: VKVYDTETPEGYEKWKELARESHGMADV.
| Complex | ipTM | ipSAE | iLIS | Notes |
|---|---|---|---|---|
| Peptide binder + reference pre-fusion F | 0.898 | 0.616 | 0.563 | confident closed-state interface |
| Peptide binder + sequenced pre-fusion F | 0.909 | 0.635 | 0.578 | confident closed-state interface |
| Peptide binder + reference post-fusion F | 0.159 | 0.000 | 0.000 | no confident open-state interface |
The properties of the binder are pretty good, but not ideal.
The ipTM is high; the ipSAE is relatively high, given the size of the peptide; the iLIS is far into the "confident" range (>0.223), implying a low false positive rate.
One potential limitation is that in theory the pre- and post-fusion forms of the F protein have the same epitope, but when I refold with the post-fusion form it does not appear to bind. In practice, we probably only care about binding the pre-fusion form (before adhesion has occurred).
So I can't say it's definitely a binder, but I think it has a reasonably good shot of binding. Usually, if there is a known binder in PDB, making another binder for the same epitope is not so difficult.
How to make the peptide
There are two main ways to make a peptide: with a ribosome or with chemistry (solid phase synthesis). If you use a ribosome (i.e., translation in a cell or cell-free system), then you need to purify the peptide. For short peptides it's generally easier to synthesize chemically. For example, you can order a peptide from GenScript for around $10-25 per amino acid.
The main advantages of using chemical synthesis are (a) purity: specifically, the lack of endotoxins you get with ribosomal production; (b) the ability to go beyond the simple 20 proteinogenic amino acids.
For this peptide, we may want to add an N-terminal Palmitic acid or a similar fatty acid, which should anchor the peptide in the cell membrane, and prevent it getting flushed as mucus refreshes.
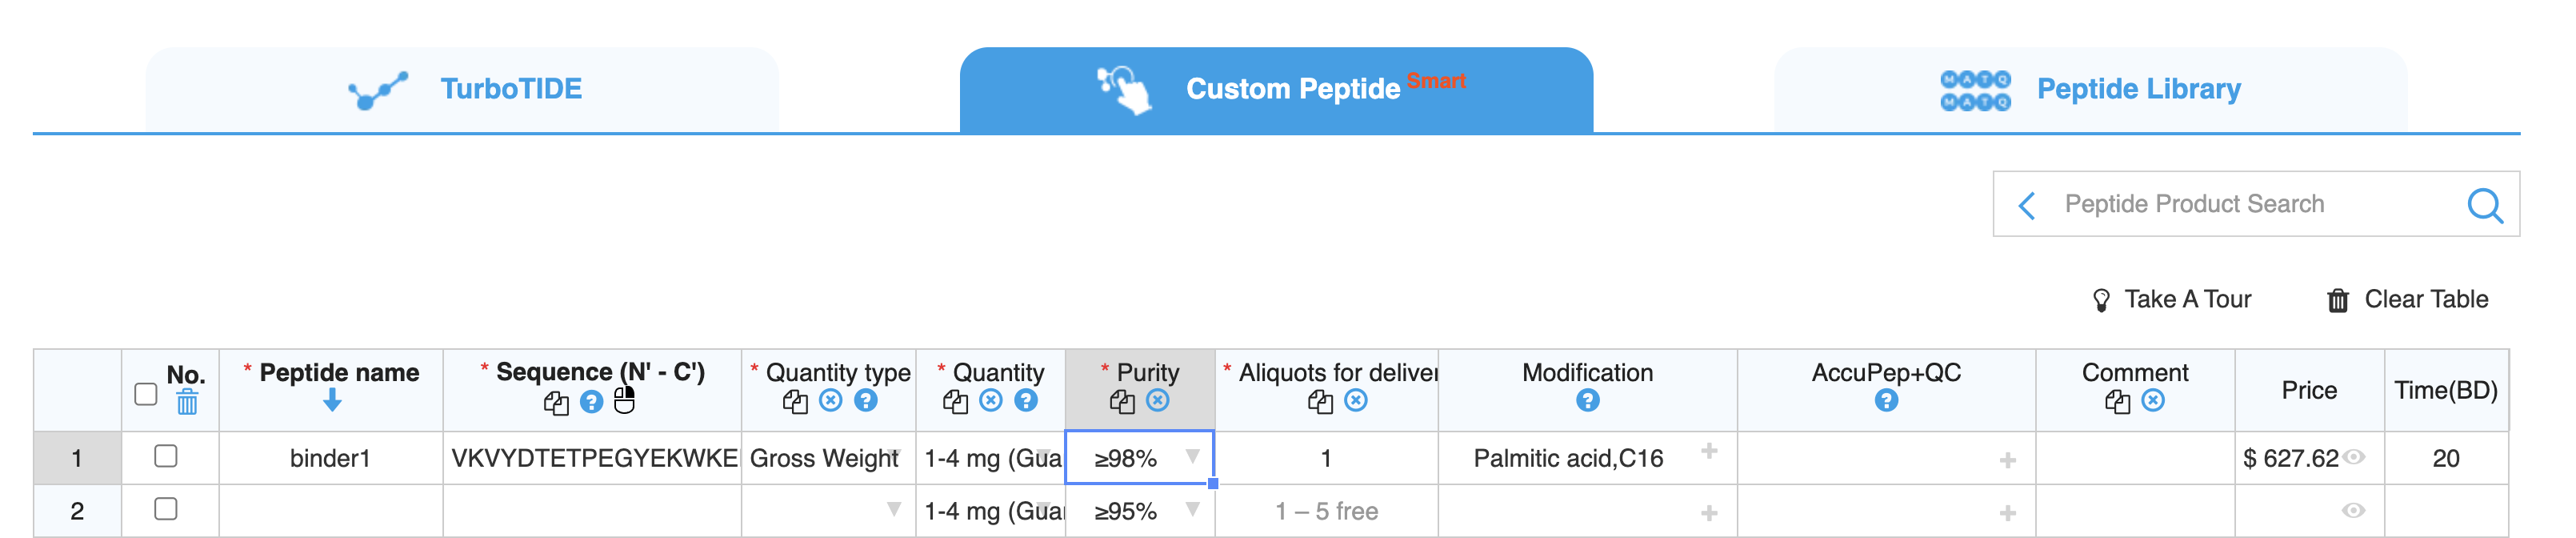 This peptide would cost around $600 and take around 20 business days to arrive
Note, I did not test the binder against the F protein! Maybe I'll do it at Adaptyv at some point just for interest's sake.
Safety
One big open question is whether a peptide like this, sprayed into the nose, would be safe. The main reasons I think it probably would be are that (a) it's extracellular; (b) our noses are exposed to tons of peptides all day (e.g., pollen); (c) if the user experienced irritation, they could stop using it—it doesn't persist.
I did a quick review of the literature, and did not find much on the topic.
Conclusion
It's fun to sequence viruses and design peptide binders, but how would a peptide therapeutic like this actually work in practice?
Detection
First we would need a rapid test that could tell us which virus is present. In theory, sequencing would be best. Oxford Nanopore could do it, but it is still a bit impractical, especially since you'd need RNA, and ideally results within an hour or so.
The most practical thing would probably be an ELISA, similar to the rapid COVID-19 tests. Today you can buy a COVID-19 / Flu A/B / RSV test in the US for around $10. Or, if you go on alibaba, you can buy a 10 in 1 test that includes HMPV for $2.
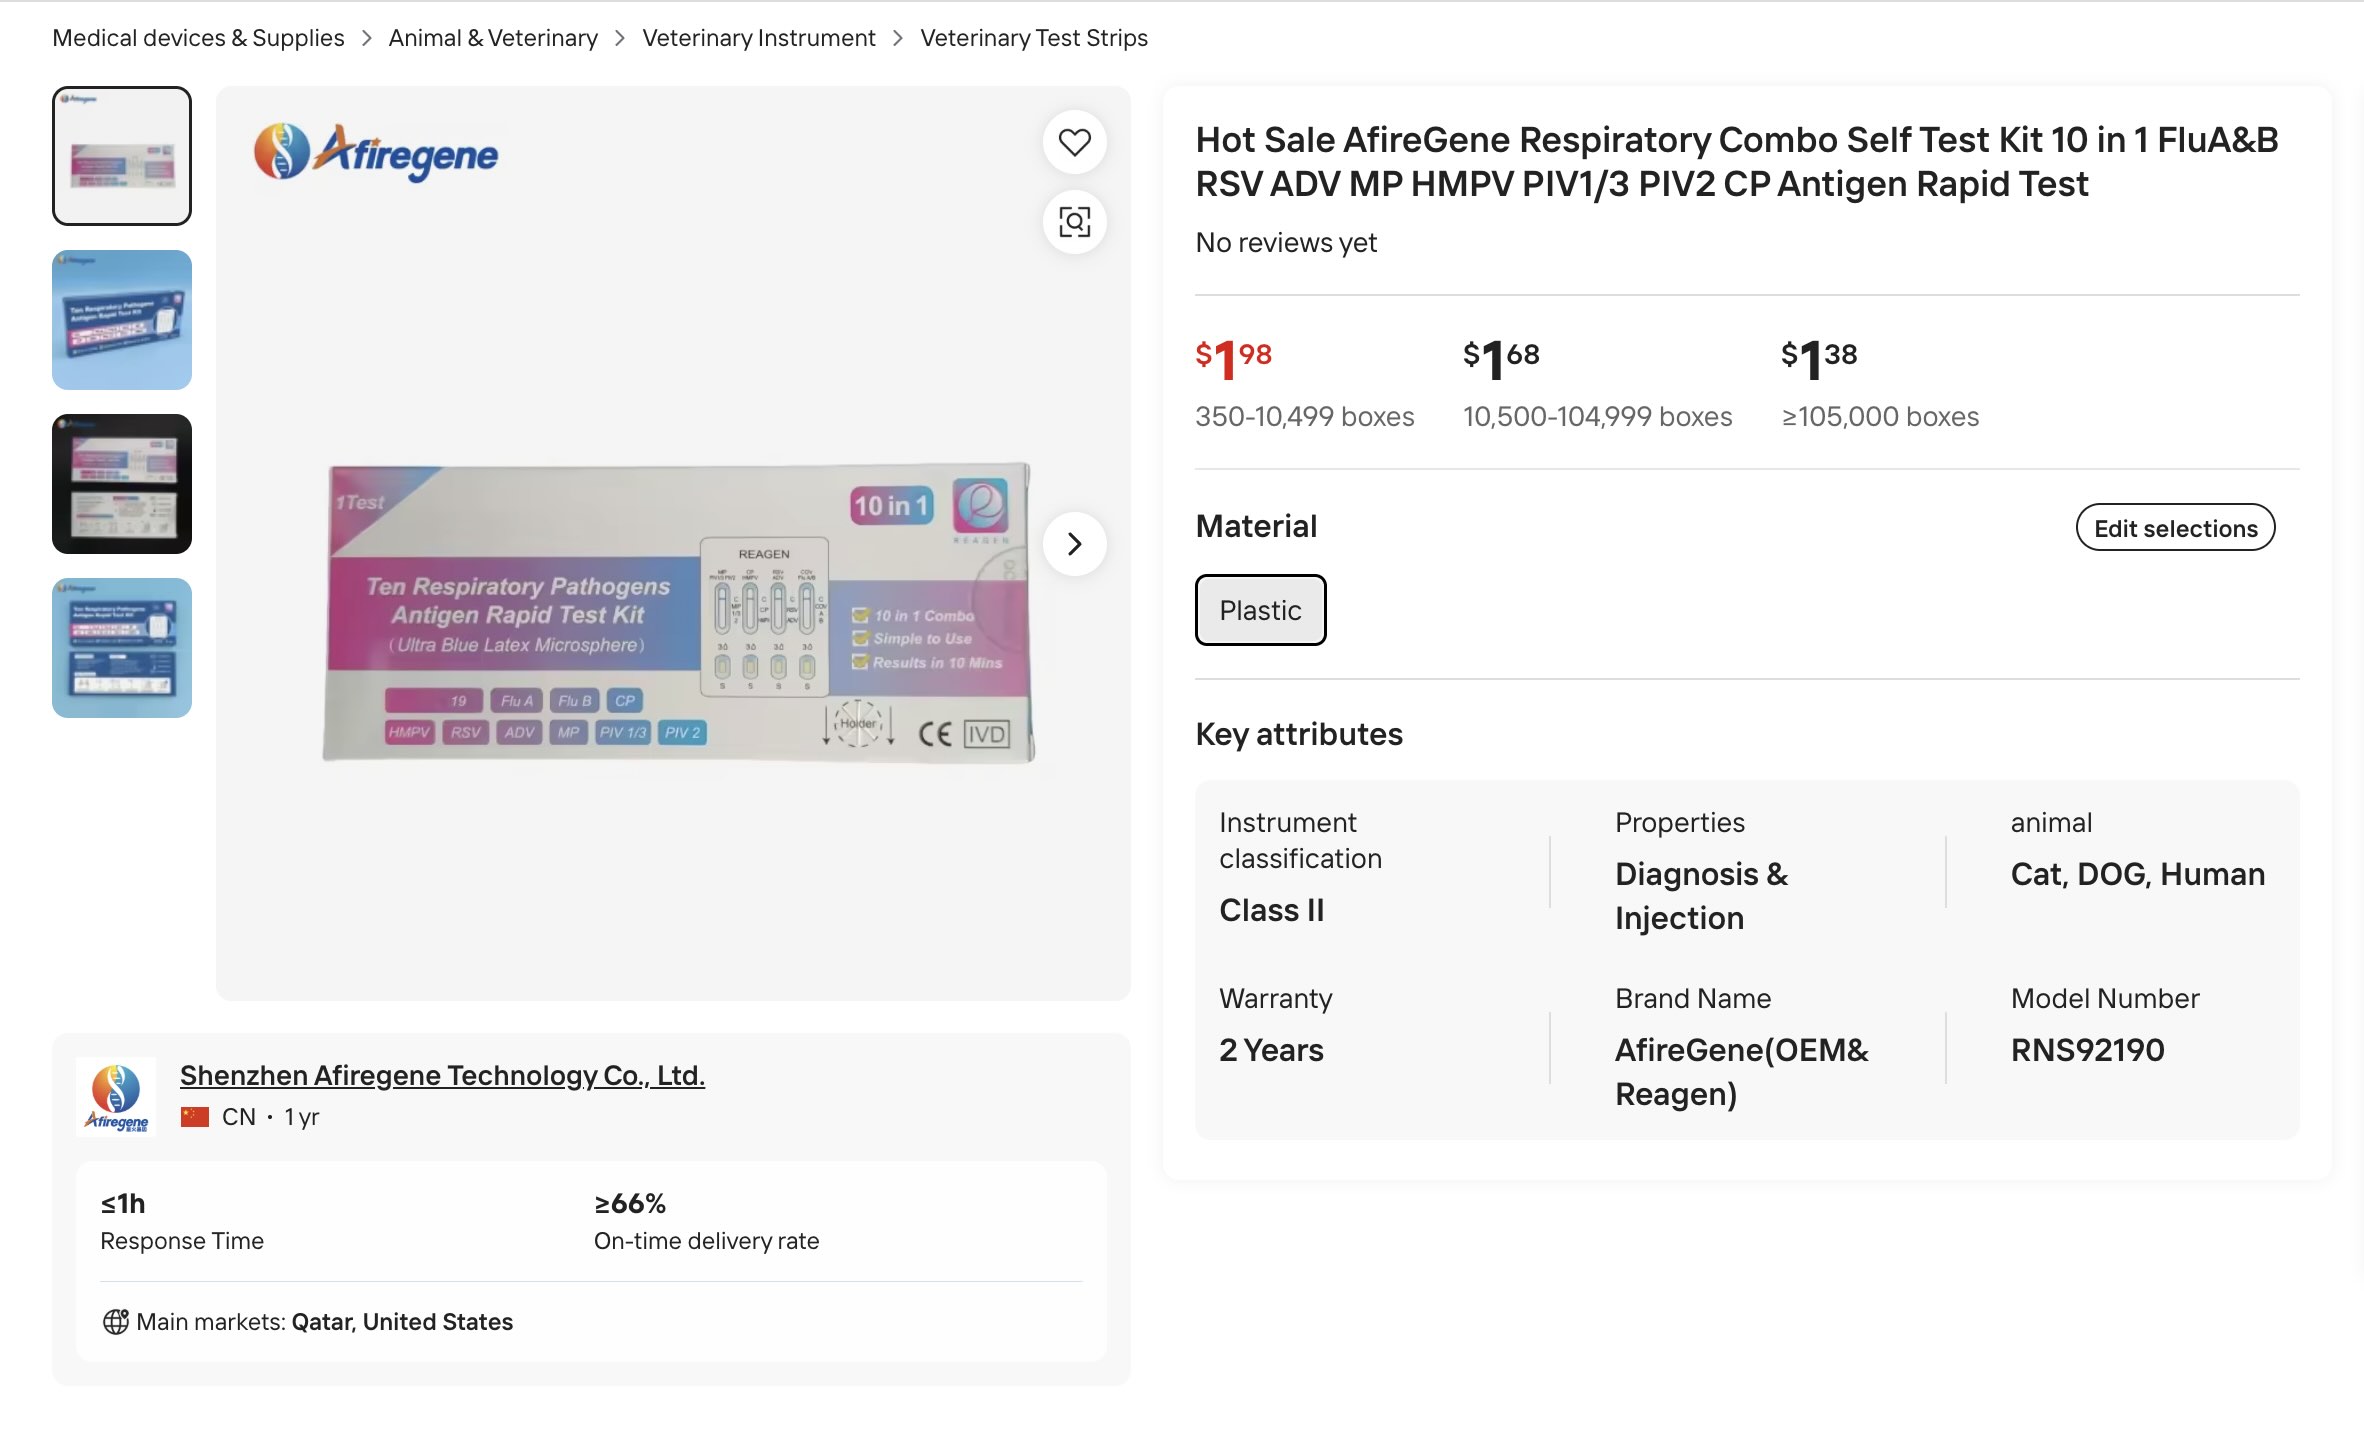 10 in 1 test kit for "cat, dog, human"(!)
Once you have identified HMPV as the virus, then you would spray the peptide in your nose. Would this actually work post-infection? That is very unclear, though even "protective" sprays like carrageenan do appear to reduce the duration of infection. It is much more likely it could prevent others from getting the virus.
My original idea here was to see if it would make sense to sequence and make a personalized peptide per virus. The answer is probably no, because, as we saw, the viruses are usually not that different, and the steps currently take way too long when a virus can run its course within a week or less.
Instead, we could make a cocktail of peptides to address the top ten common cold viruses. Influenza may evolve too quickly to be included in the panel—it depends on whether we can design a binder to a slowly-evolving part of the virus. Arguably this is all overkill when safe, protective nose sprays exist, but we should do it anyway!

 Like protein folding tools,
  Mosaic-TUI has a sweet retro-futuristic UI