Scoring protein binders with ipTM and other scores

Readers of this blog will be well aware that it's an exciting time for AI protein binder design. Since BindCraft was released in 2024, there has been plenty of activity, but things have heated up again over the past couple of months with the release of BindCraft2 from Pacesa Lab, RFD4-Proteina from Baker lab, a report from Anthropic, and several high-profile competitions run by Adaptyv and Anthropic.

There remains a pretty central question of how to rank binders to maximize wet-lab success. Last week I posted a table comparing the main binder ranking scores on twitter. It was a quick and dirty AI-driven experiment, but it generated some interest, so in this article I am going back to do it again a bit more carefully!

How does binder scoring work?

When designing a binder we are attempting to select a sequence that optimizes a certain score (or loss).

Binder design scores are usually a weighted combination of two types of score:

  • folding model confidence scores (e.g, pLDDT, ipTM, ipSAE, iPAE, actifpTM);
  • heuristics like sequence "naturalness", and physics-based filters like surface complementarity and number of H-bonds.

Only folding model confidence scores correlate strongly with binding, but directly optimizing these scores can easily lead to adversarial sequences. As we know, AIs are great at "hacking the test". It's also worth noting that these scores are not trying to measure binding per se, but more like whether the structures appear together in a PDB file. See the escalante blog for more details on this.

The heuristics and physics-based filters bias the binder sequence and structure to the part of the distribution where real binders live, but this is something of an art for now.

A simple method to help with adversarial sequences is to refold and rank with confidence scores from independent folding algorithms, e.g., design with RFD4-Proteina, and rank with ESMFold2.

Binding score types

The original "binding score", introduced by AlphaFold-Multimer in 2021, is the "interface predicted TM-score" (ipTM). ipTM is calculated directly from the predicted aligned error (PAE) distribution.

PAE evaluates positional error using the local backbone reference frame of each residue, rather than a global alignment. Because each residue defines its own reference frame, PAE is asymmetric. iPAE is just the PAE between chains (e.g., binder and target). Despite the name, ipTM compares two complete chains, not just the interface.

An obvious limitation here is in cases where the model is confident in the interface and not confident about the rest of the protein. In 2025, two scores were published to correct for this problem: ipSAE and actifpTM. This year, BindCraft2 introduced one additional refinement: ipDAE. These three scores are all quite similar, differing mainly in how they select the relevant interface residues.

On twitter, I was fortunate to get some background and feedback from Julia Varga around actifpTM thresholds and Roland Dunbrack on using ipSAE for binders (published in the new ipSAE2 paper).
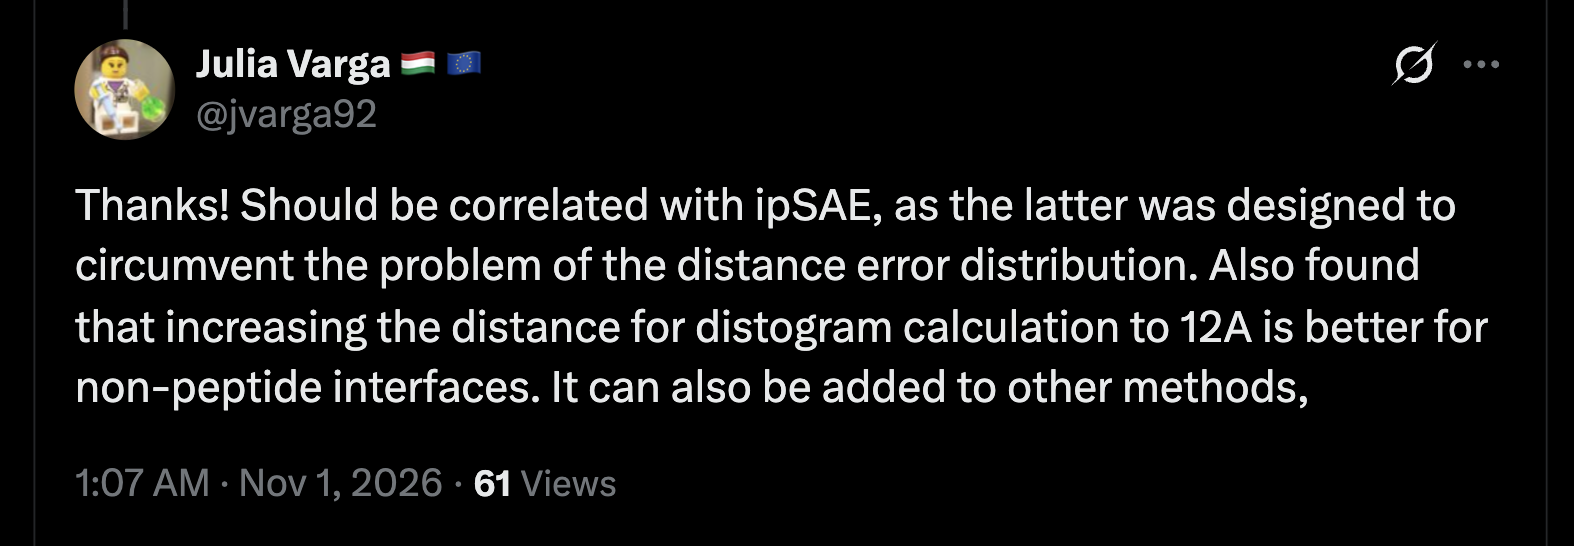
Julia Varga commenting on actifpTM and suggesting a threshold change. I did not test it here.
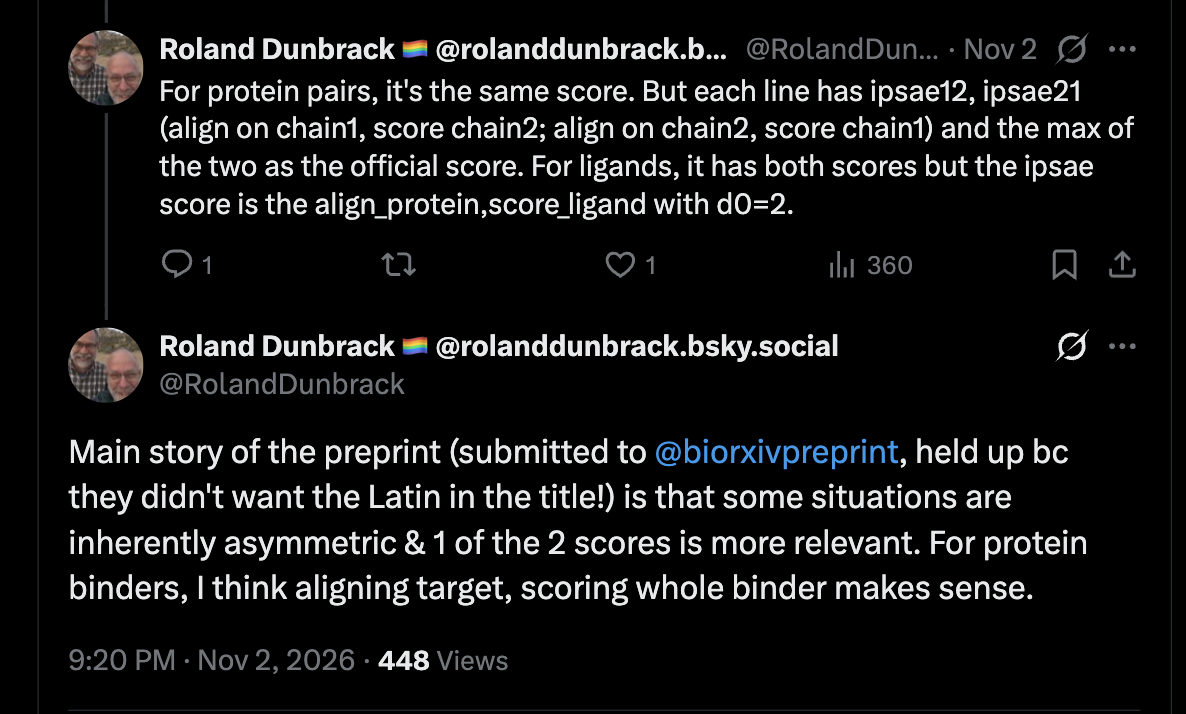
Roland Dunbrack recommending a specific ipSAE variant for binders

I was surprised to see that these scores are also in flux: since PAE is asymmetric, you can take the minimum, maximum, mean, or a specific direction (e.g., align on target and use the binder ipSAE). On the BindCraft2 repo, they switched from max to mean ipDAE just a couple of weeks ago!

Scoring

I could only find a few papers on the topic of binder ranking scores:

  • Overath et al. 2025, "Predicting Experimental Success in De Novo Binder Design: A Meta-Analysis of 3,766 Experimentally Characterised Binders"
  • Cotet et al. 2025, "Crowdsourced Protein Design: Lessons From the Adaptyv EGFR Binder Competition"
  • Bozkurt 2026, "Beyond Structure and Affinity: Context-Dependent Signals for de novo Binder Success"
  • Liu et al. 2026, "ProtDBench: A Unified Benchmark of Protein Binder Design and Evaluation"

Overath et al. is really the only paper here that tries to compare binder scores across many targets. They took a classic machine learning approach of calculating as many features as they could (over 200) and attempted to predict binding across 3,766 binders and 15 targets. Their conclusion was that AlphaFold 3 ipSAE (minimum) was the single best score, with Rosetta interface energy and shape complementarity also contributing.
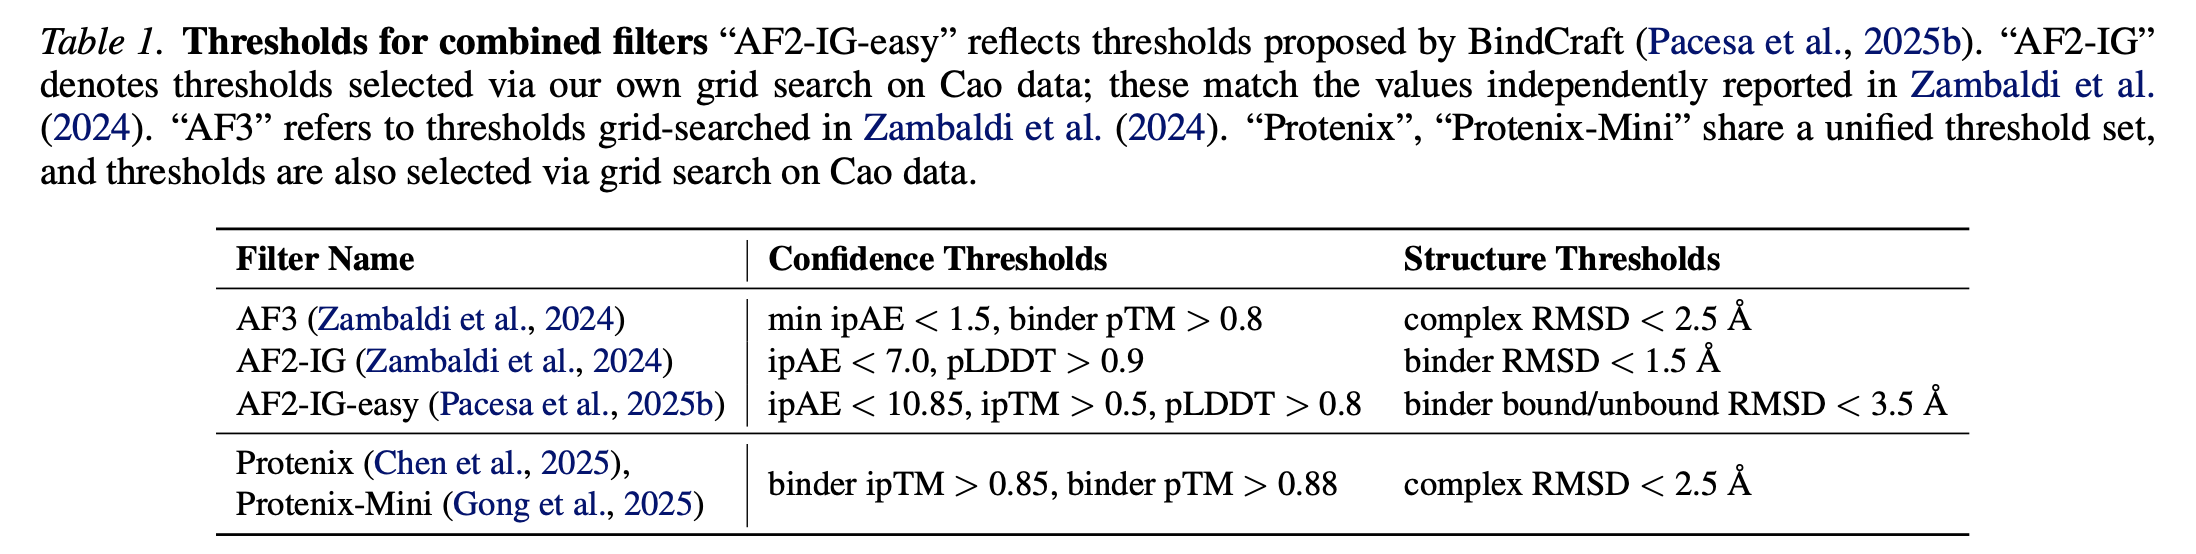
ProtDBench is a binder design benchmark. The paper includes some commonly used binder thresholds.

My Proteinbase Benchmark

I used Adaptyv's open Proteinbase database for this experiment. For each of the 24 suitable targets in the database, I took all available binders and an equal number of non-binders. In total, I co-folded 225 binders and 225 non-binders. All are protein binders, of length 10-250 residues, with an average length of 92. There were a negligible number of antibodies or antibody fragments, so these were excluded.

All the data is in this Hugging Face repo, so point your agents here to reanalyze it!

Folding models

Since I work at a company, I can't use AlphaFold 3; instead I use these MIT or Apache-2 licensed tools:

  • ESMFold2 is very fast and still reliably high quality;
  • OpenDDE is an excellent new model, especially good for antibodies;
  • Mol-1 is only a week or two old, but the benchmarks are impressive across the board, including for antibodies. Mol-1 has succeeded Protenix-v2, which confusingly went from open to closed weights, and so is best avoided.

Depending on how much you trust the benchmarks, OpenDDE and Mol-1 can get close to or beat AlphaFold 3, even on antibodies.
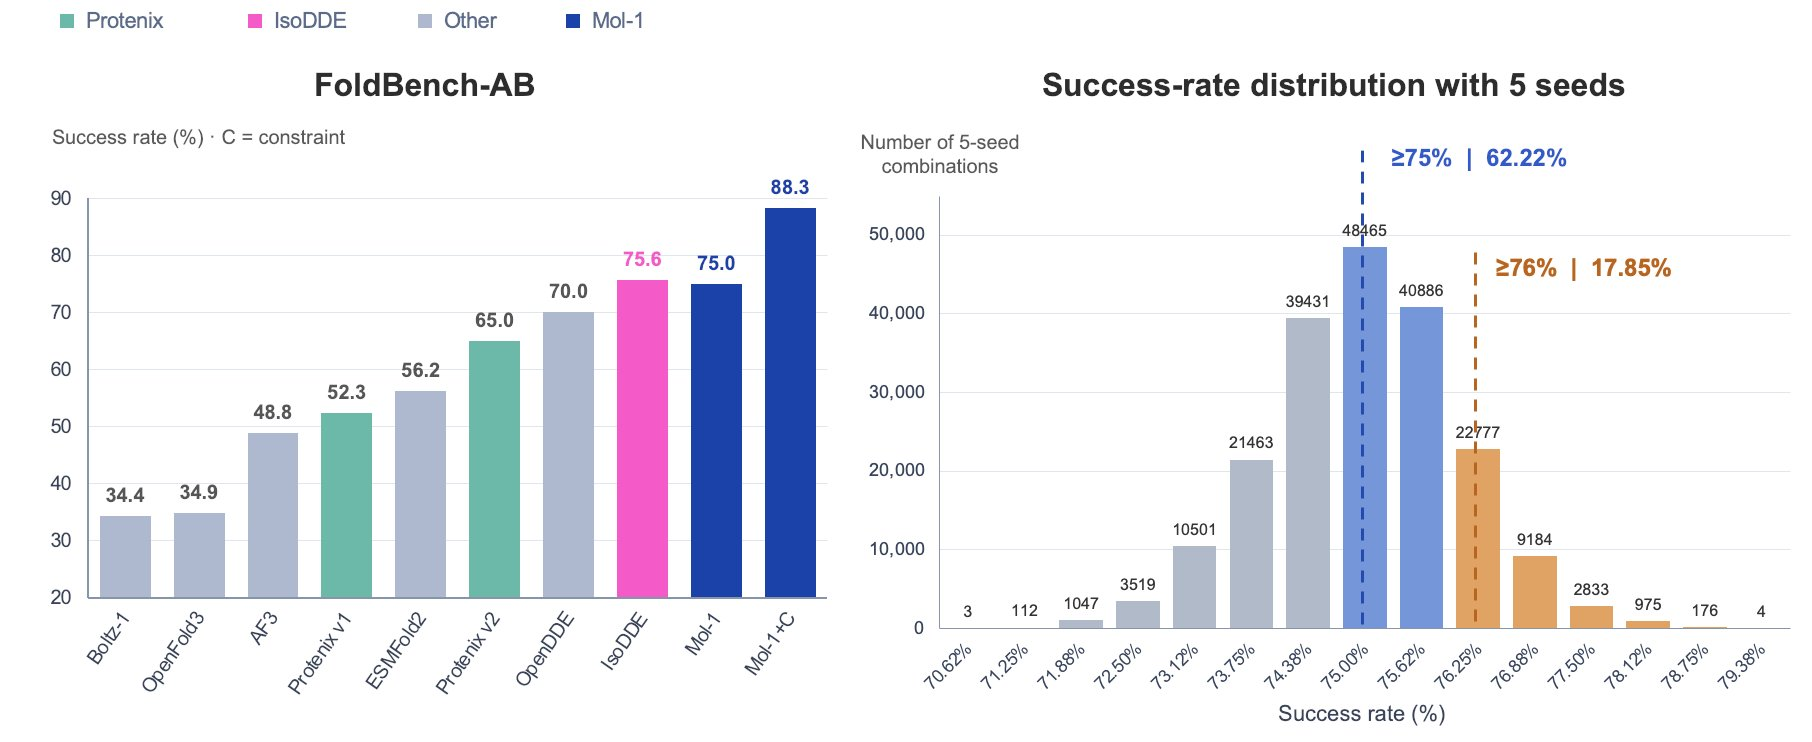
Mol-1 showing some impressive performance on FoldBench.

Results

There are many ways to look at the data. I used two main scores: the PPV for the top 10% of scores, and the AUROC. In both cases I take the average value across all targets since some targets have a lot more data than others. Since there are equal numbers of binders and non-binders, random guessing would score 50%; in the real world there will be many more non-binders to filter out. I tested four folding models (ESMFold2, Protenix-v2, OpenDDE, Mol-1), and a consensus "all four models" version where I use the worst percentile rank across the four models.

In all cases I am using the default version of the score. For example, this means I am using max ipSAE, not min ipSAE as recommended in Overath et al. I did some additional analyses where I explored variations of the scores, and found minimal differences.
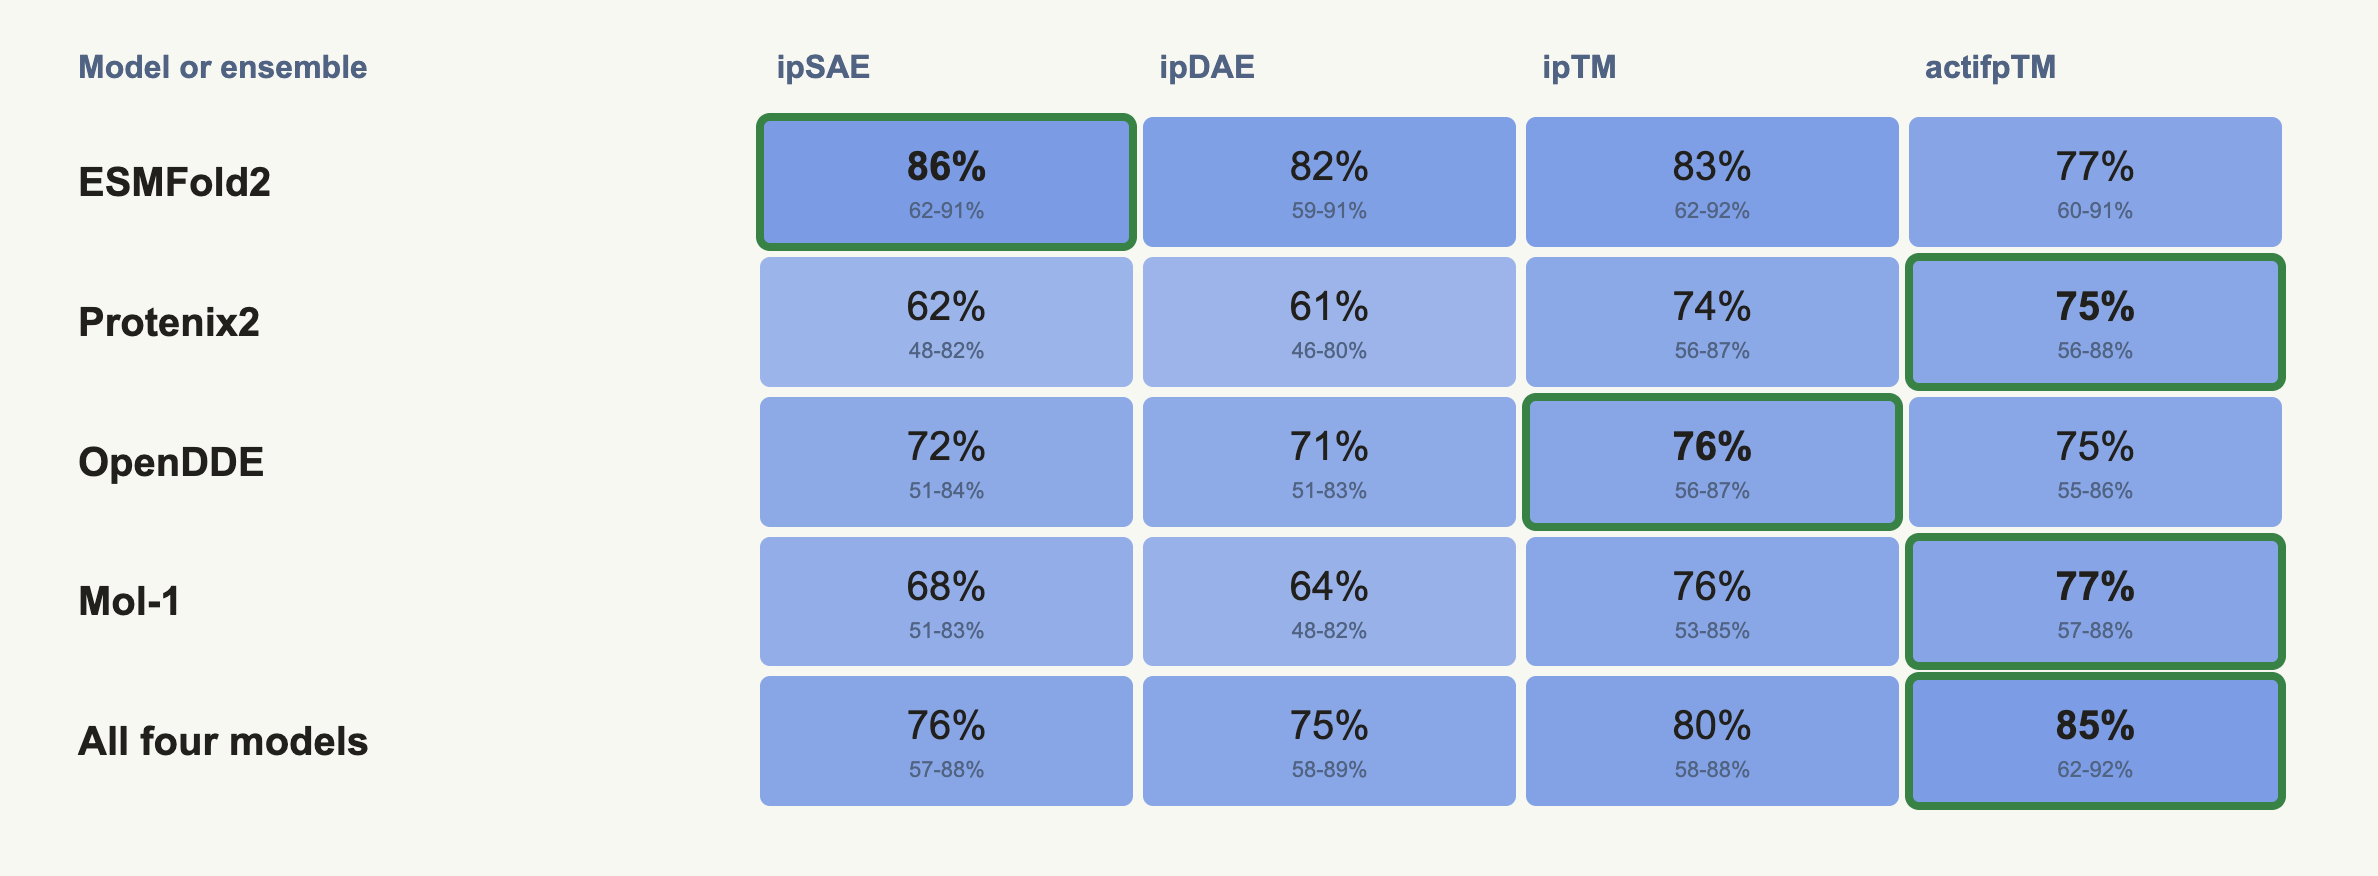
Top 10% PPV. The best score is highlighted in green; 95% bootstrap CI in small font underneath.
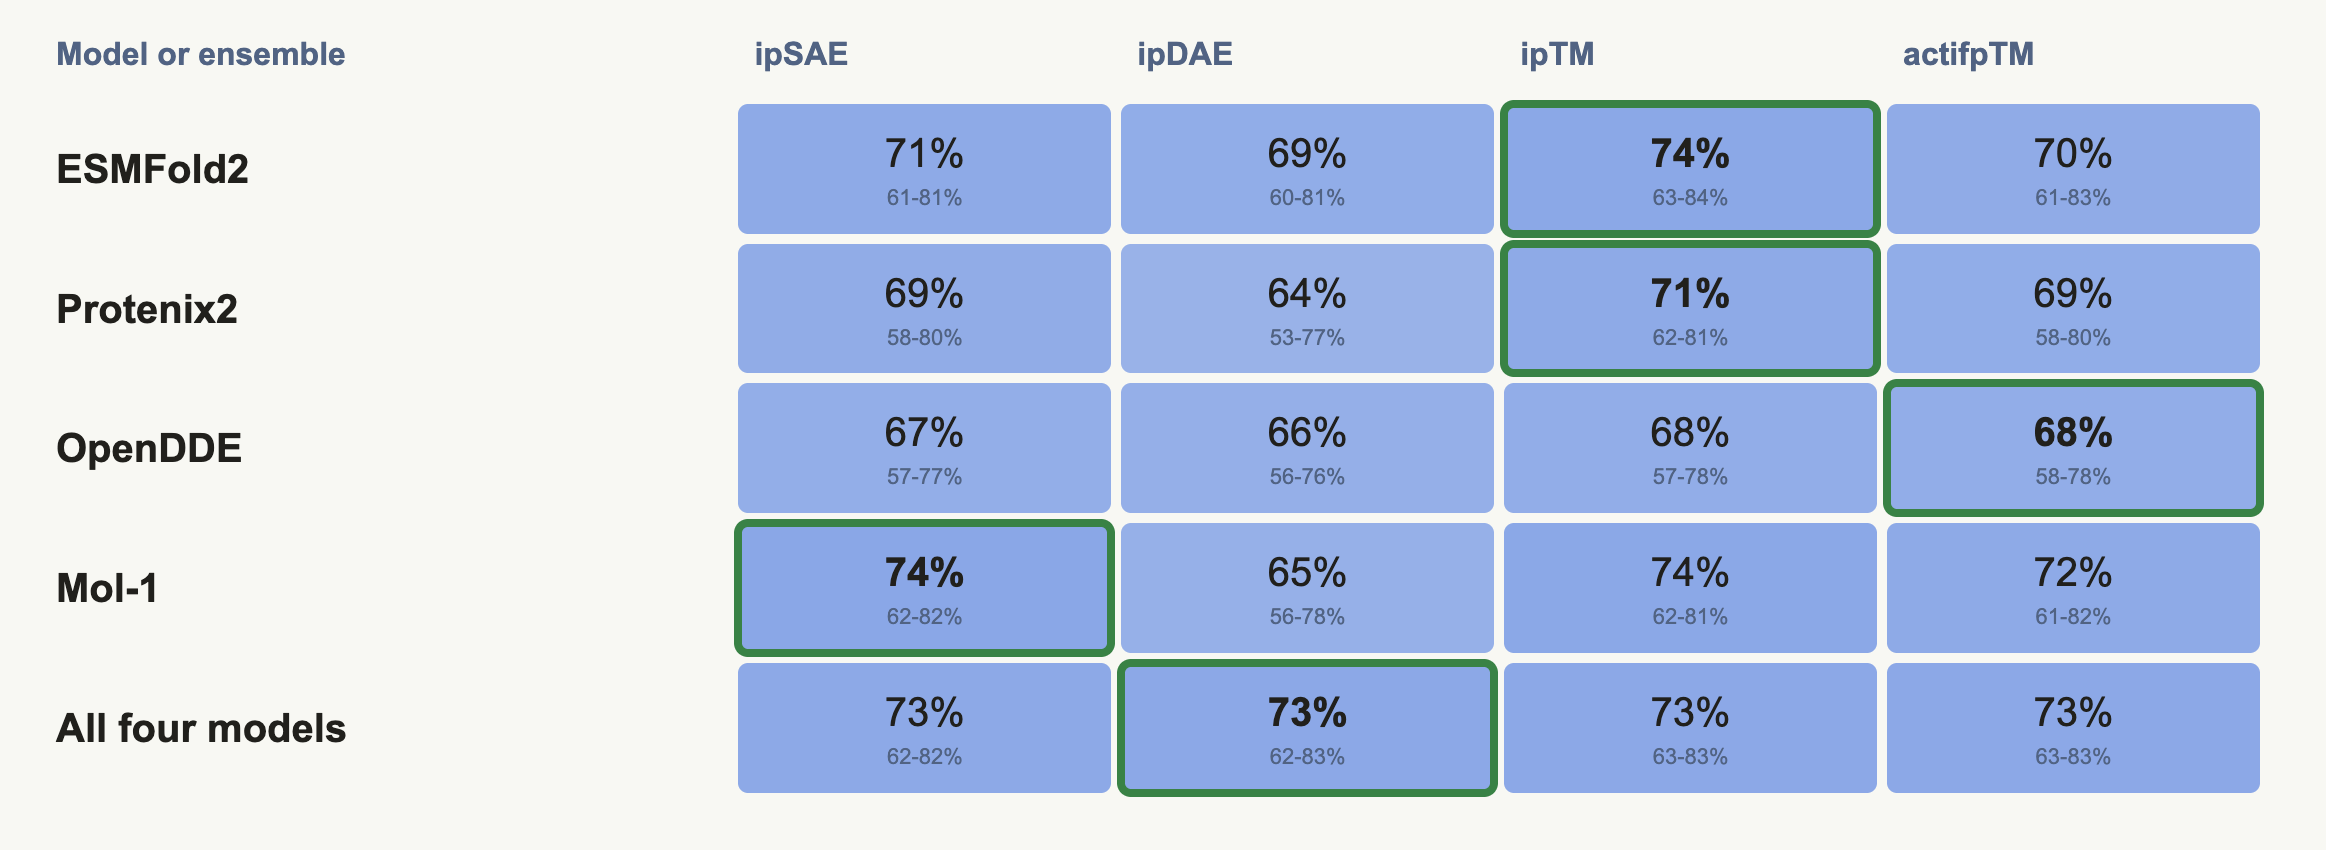
AUROC. The best score is highlighted in green; 95% bootstrap CI in small font underneath.

I was surprised at how well ipTM did. All folding models produce this score by default, so it's easy to get, and it performs well across the board.

ESMFold2 also deserves a shout-out. It's the oldest and fastest method here, but it's still performing very well.

I thought I had a pretty decent amount of data here, but even so, using paired comparisons, I could not detect significant differences between any of the scores. Maybe because they are all derived from the same aligned error data. I don't think this means they all perform the same, but I'd need quite a bit more data to find daylight between them.

Note that many of these Proteinbase submissions were selected for high ipTM, so there is also some selection bias.

Foldism

I have an open-source folding tool called foldism. It runs on modal and includes AlphaFold 2, ESMFold2, OpenDDE, and Mol-1. I removed Boltz-2, Chai-1, and OpenFold to streamline it, but these are easy for an agent to add back in. I updated the code to calculate ipTM, ipSAE, ipDAE, and actifpTM, giving the score and a percentile from the distribution of non-binders in my dataset above.
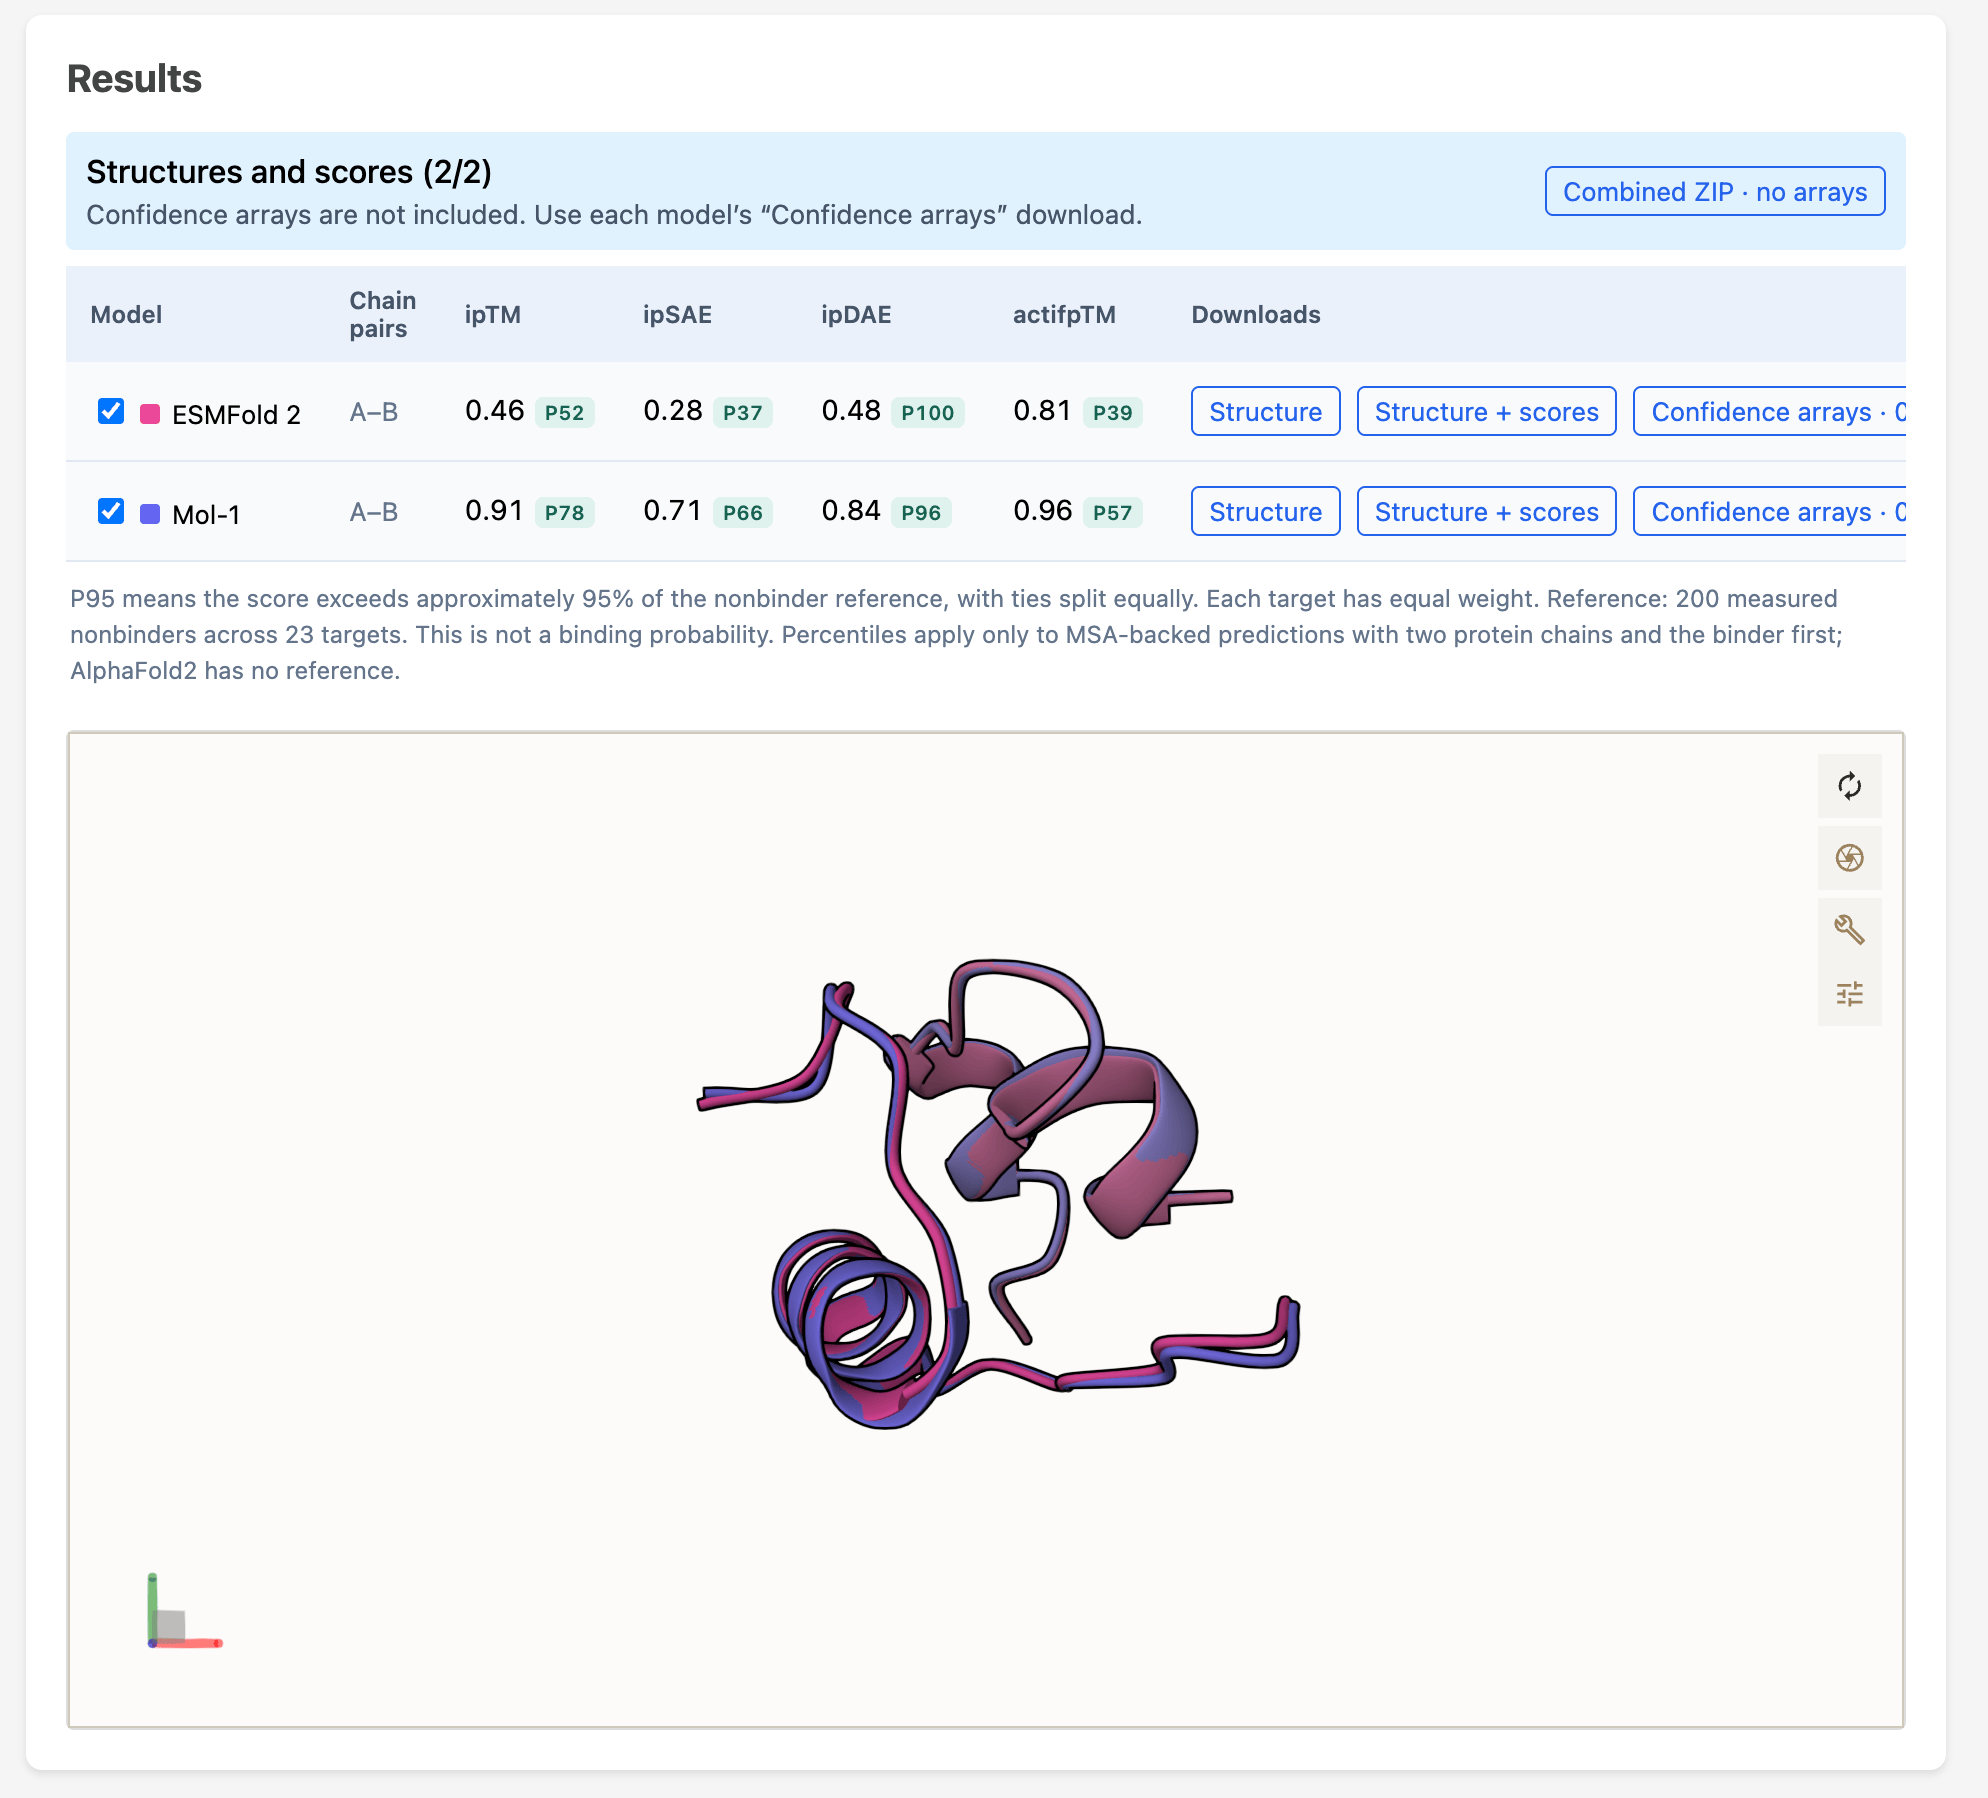
Insulin's two chains co-folded and scored with foldism. It's not a true binder, but only ipDAE gives a high percentile here (96–100).
OCR for biological sequences

One of the minor irritations in my life is that OCR does not consistently work for biological sequences (nucleic acids and proteins).

People think of OCR as a solved problem because AIs are very good at it, but the mistakes AIs make in human language are usually forgivable: maybe an O instead of a 0, or a hyphen instead of an en-dash.

Biological sequences have peculiar challenges: they can be thousands of characters or more; they are often repetitive and high entropy compared to human language; they are fairly often embedded in images, whether that is a scanned PDF, or a rasterized figure in a paper. Most importantly, a single typo can break the whole sequence.

Patents

Patents have some of the most useful biological sequences, and some of the worst OCR problems. Google Patents includes the reference/original PDF of the patent (the USPTO certifies PDFs), and an OCR'd html page, which can have errors. Most of the time, the PDF contains extractable text, and no OCR is necessary, but even then, the sequences often live in images.

I got an AI to examine a sample of 100 patent PDFs, with 25 patents drawn from each of four publication eras (before 2000, 2000–2009, 2010–2019, 2020 onward). 11/100 contained no embedded or extractable text on any page (i.e., all images). Surprisingly, all were published in the last five years (e.g., US11584788B2).

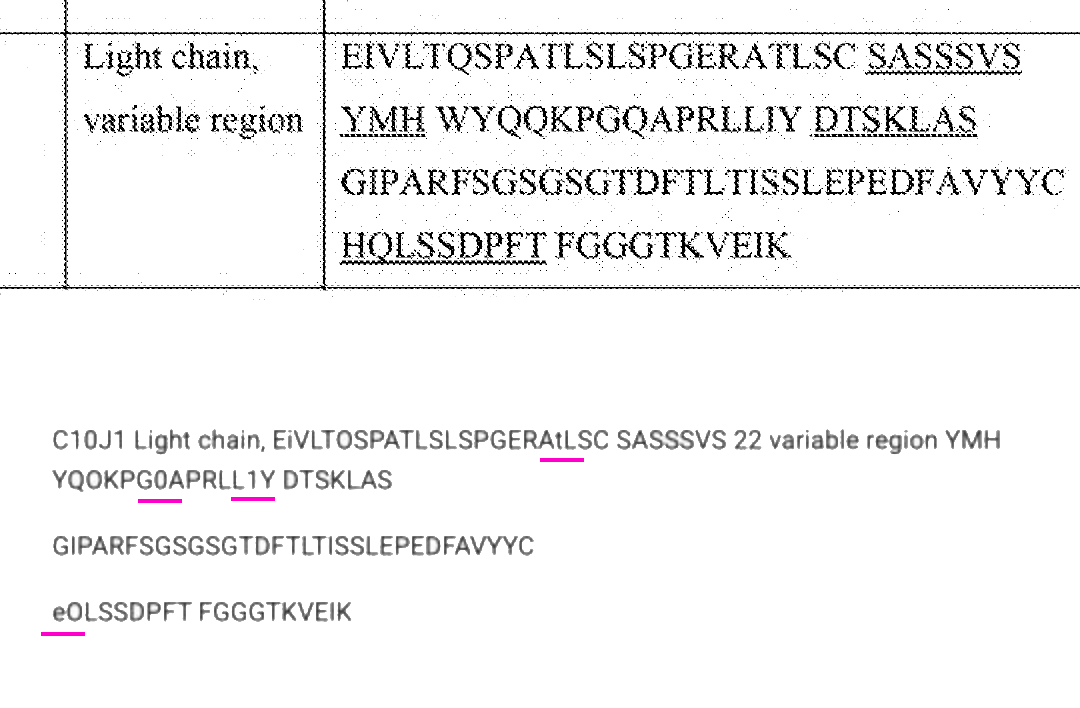
I tried to find some illustrative examples of failed OCR: in WO2017040932A1, the Q in EIVLTQSP is rendered as O for SEQ ID NO: 22; in US11965030B2, Gln is rendered as GIn in two occurrences, SEQ ID NOs: 15 and 19.

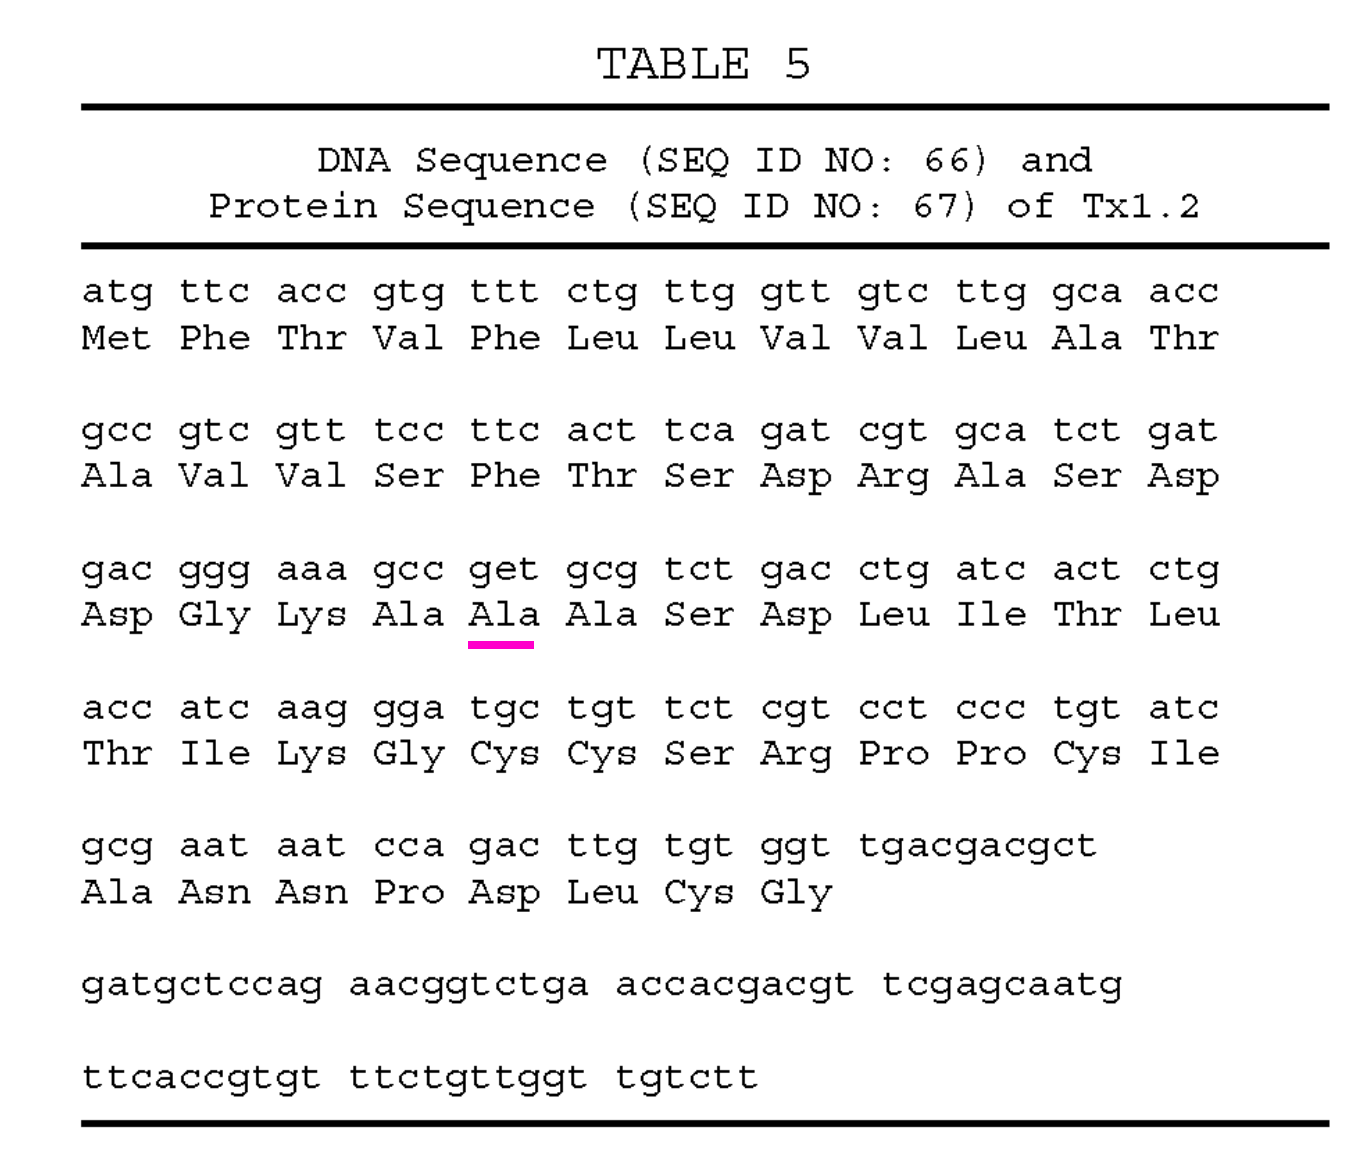
Patent WO2017040932A1 PDF (top) vs HTML (bottom). There are multiple OCR errors underlined in pink. This is a grainy image, but readable by a human.

In the process of this search, I was a bit surprised to find that in most cases of impossible DNA or protein sequences, the PDF itself contained the typo.

Patent US8110549 has an impossible codon (underlined in pink).

I tried to do a more comprehensive evaluation of the prevalence of such errors, but it would have taken a ton of manual review. I think it probably makes more sense to wait a year and get a smart AI to do it.

OCR

There are two main kinds of OCR: specialized OCR tools like hoary mainstay tesseract, which works well but is tuned for human language, and AI OCR tools (just asking ChatGPT, Claude, Gemini), which are smarter but have the tendencies of a human reader, and so can get confused or distracted.

Broadly, the most common failure modes I have seen for these are:

  • specialized: mistaking Gln for GIn (not enough intelligence to understand that this is a sequence of amino acids)
  • AI: miscounting or losing track of the number of repeated characters (homopolymers)

Benchmark

Last year, after failing to extract some not-especially challenging protein sequences from several PDFs—forcing me to spend hours manually typing them in—I got annoyed and decided to make a benchmark.

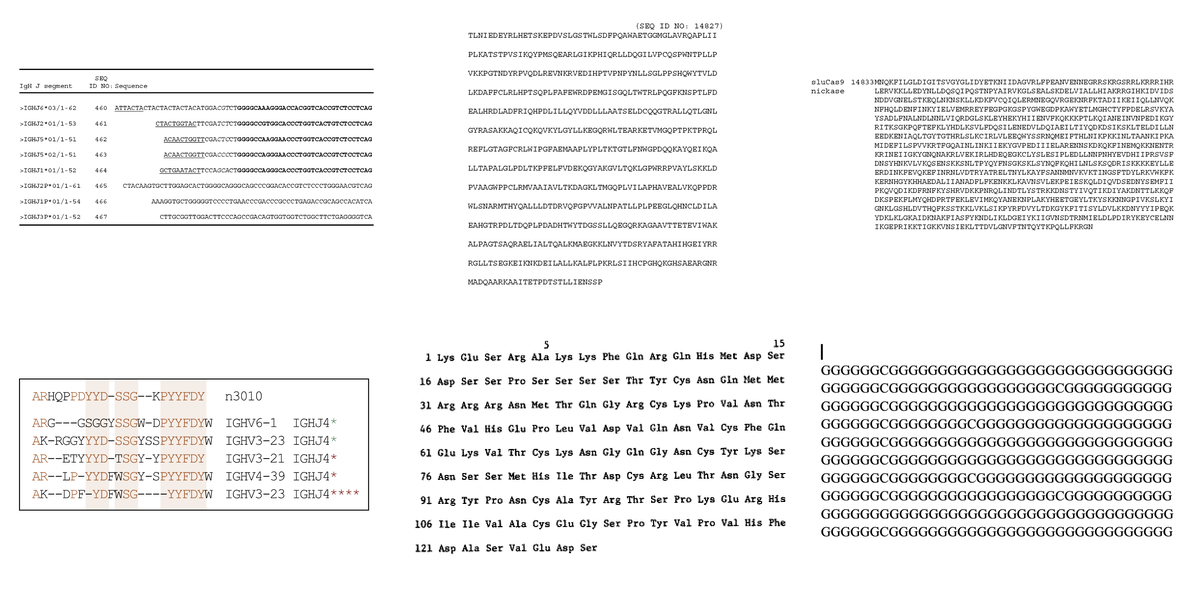
I chose six sequences. These were an attempt at a representative sample, and were not chosen to be especially challenging. I created a bio_ocr_minibenchmark repo to let me test out methods and see what works best.

The six sequences in the benchmark are not particularly challenging.
These are all monospace fonts, have a constrained alphabet, and clear, uncorrupted images. Yet I have tried every OCR system I could find over the last year and so far nothing has gotten all of them correct. Almost everyone is surprised this is still an issue!

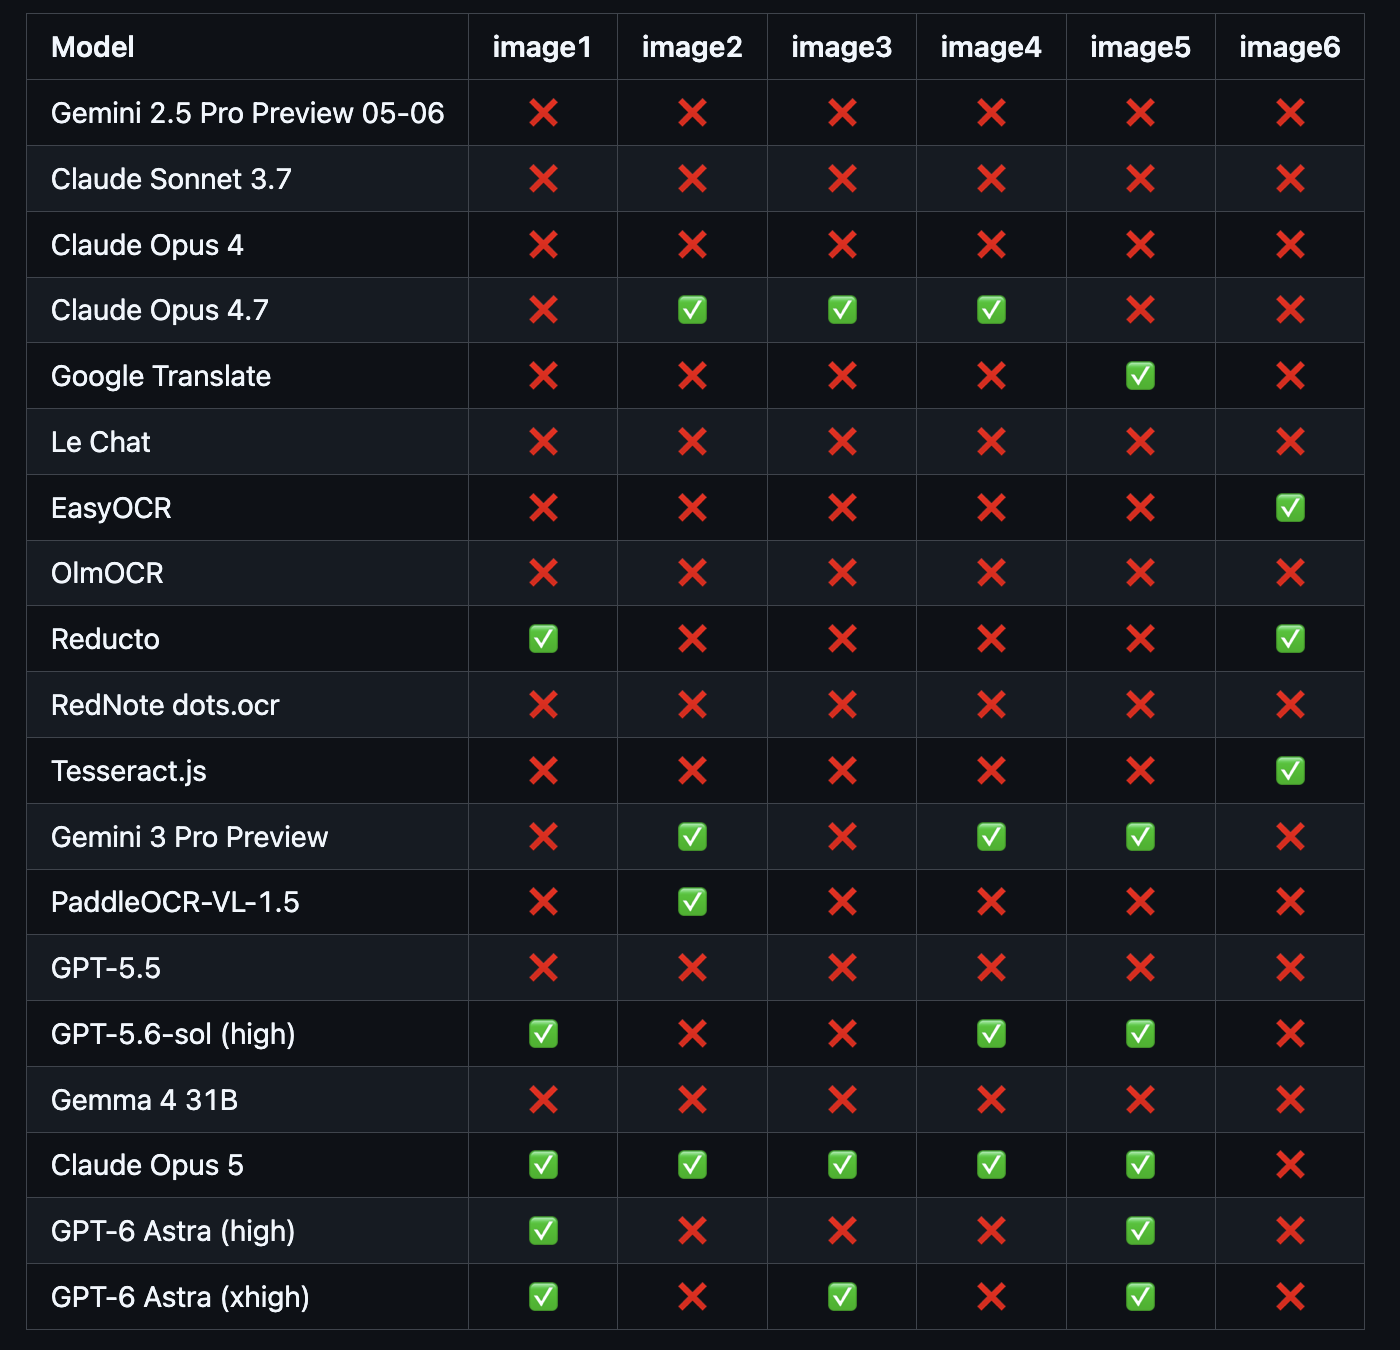
There has been progress in just the past few weeks. Opus 5 and GPT-6 Astra are the best I have tested so far (Fable refuses any biological work, so I can't evaluate it). Specifically, Opus 5 gets 5/6 correct, failing on image 6, which is just some Gs and Cs I typed into Google Docs! It loses count and adds some extra Gs for no reason.

The benchmark includes specialized OCR tools and AI OCR tools. There has been steady improvement over time.

Conclusion

We do not yet have a robust way to extract biological sequences from images. This is surprising, and a pain.

I think we are still maybe a year or more from a fully trustworthy OCR system you don't have to double-check, which is crazy to say given the current capabilities of AI generally.


Using Claude Code for computational biology

People are very excited about Anthropic's new Opus 4.5 model, and I am too. It is arguably the first coding model that can code continuously for hours without hitting a wall, or entering a doom loop (continually producing the same bugs over and over.)

Opus 4.5 has crossed a threshold where it has led to what appears to be a permanent change in how I work, so I wanted to write up a short article on this, with a real-world example.

For software engineers, it's obvious how coding agents help: they write code for you. For computational scientists, writing code is one step of many: you read papers, download tools and data, log the steps and parameters of the experiment, plot results and write it all up. This is where agents like Claude Code shine.

Claude Code

There are two main ways to use Opus 4.5: in the Claude chat interface, just like ChatGPT etc., or as an agent in Claude Code. The difference is that an agent is a program running on your computer: it doesn't just produce text, it can run arbitrary commands in the terminal on your behalf.

With Opus 4.5, Claude Code is good enough that it is starting to become my primary interface to the terminal, not just my primary interface to code. This is a little hard to explain, but I will show a real-life example from my own work that hopefully illustrates the point.

You can categorize the eras kind of like self-driving cars. The first era, with zero AI, ended just a few years back, and I now feel like I am now on era four. Things are progressing quickly!

  1. Manual: I write code; I run code; I review output (most of my career!)
  2. Copilot: I co-write code with AI (e.g., in an IDE like Cursor); I run code; I review output
  3. Human-in-the-loop: Claude Code (CC) writes code; I read code to check it; I run code; I review output
  4. Agent: CC writes code; CC runs code; CC and I review output
  5. Teams of agents: A team of CC agents write code, run code and review output over multiple hours; they contact me when they need input
  6. Autonomous: A team of CC agents work collaboratively and never need my input??

Adding ipSAE to af2rank

The task here is to add the ipSAE statistic to my af2rank modal app in the biomodals repo. The details don't matter too much, but ipSAE is a popular method of scoring protein–protein interactions—for example it is used in the recent Nipah protein design competition from Adaptyv—and there is a reference implementation on github.

Below are my two(!) prompts to Claude, abridged responses from Claude, and the final result. The full transcript is long so I have included it at the end of the post. There you can see more of the warts and debugging, and how much the model does besides just write code.

[Me] >clone the https://github.com/DunbrackLab/IPSAE repo, extract the ipsae scoring function, and add it to the af2rank modal app

[Claude clones the IPSAE github repo, finds the relevant files, reads the code, finds my modal_af2rank.py file, reads it, and updates it]

[Me] >ok test the repo to make sure it works using a test pdb file as in the docstring; then run ipsae and compare the results to make sure the calculation is correct

[Claude downloads a test pdb file, runs the modal app, learns how to run the reference IPSAE code, debugs several issues, and finally produces a working implementation, which it validates by checking the results against the reference. Finally it summarizes all it did.]

[Claude]
⏺ Now all scores match:

  Final Comparison:

  | Metric        | Our Implementation | Original IPSAE |
  |---------------|--------------------|----------------|
  | A→B ipSAE     | 0.2760             | 0.2760 ✅      |
  | B→A ipSAE     | 0.2862             | 0.2862 ✅      |
  | A-B_max ipSAE | 0.2862             | 0.2862 ✅      |
  | A→B LIS       | 0.2998             | 0.2998 ✅      |
  | B→A LIS       | 0.2206             | 0.2206 ✅      |
  | A-B_max LIS   | 0.2602             | 0.2602 ✅      |
  | pDockQ        | 0.1476             | 0.1476 ✅      |
  | A→B pDockQ2   | 0.1612             | 0.1612 ✅      |
  | B→A pDockQ2   | 0.1289             | 0.1289 ✅      |

⏺ All IPSAE scores now match exactly between our implementation and the original IPSAE script.

  Summary of changes made to modal_af2rank.py:

  1. Added IPSAE scoring functions (lines 66-260):
    - ptm_func() / ptm_func_vec() - PTM-like scoring
    - calc_d0() - TM-score d0 normalization
    - calc_ipsae_scores() - Computes ipSAE, pDockQ, pDockQ2, and LIS for all chain pairs
  2. Modified _get_score() to compute IPSAE scores for multimer models
  3. Added CLI parameters --pae-cutoff (default 10.0) and --dist-cutoff (default 8.0)
  4. Added PAE export for external comparison (af2_scores.json and *_predicted.pdb)

Full disclosure, I have previously asked Claude Code to do this exact task before, just in a different codebase, and that time it actually went smoother. I posted that on twitter, and then thought it might make for an interesting post on the blog.

This time it was not quite as slick, but this represents a more realistic example of my typical Claude Code interactions. The path was circuitous, but it got there in the end, with zero intervention on my part. The final result is functional but overwrought.

Conclusions

I don't test all the models all the time, but Opus 4.5 is the first model I've used that can keep context and make linear progress like this, and others seem to agree. I should also note I pay $200 per month for Claude Code access, but there are lower tiers. OpenAI and Gemini both have tools similar to Claude Code. There are also cheaper but workable Chinese models like Qwen. If these are not as good as Opus 4.5 today, they will be very soon.

People are often concerned with AIs writing "slop" code, meaning poor quality or unmaintainable code. Honestly I'm not totally sure I should care about that any more? If it is maintainable by Claude, that might be all that matters.

This workflow is powerful for software, but in software you probably have to care more about maintainability and consistency. Specifically, the crux may be if a team of people is working on the same code. There are definitely examples online of software teams trying out agents, but then reverting back to no AI for this reason. Even fully AI-pilled experts like Karpathy find full vibe-coding a poor fit for many kinds of code.

I would argue these agents are a better fit for scientific code because it's usually not the code that matters but the insight. If you can test ten hypotheses in a day instead of one, or if a scientist with no deep learning experience can now finetune a model themselves, the maintainability of the code, or even the language the code is written in, matters much less.

The relationship here is more like PI–student, and in general a PI would not look at code, but would ask questions to make sure it's working as intended. You can talk to Claude in the same way ("did you check this?", "did you read this paper?").

I have started doing projects from start to finish like this, never leaving Claude Code, and that includes writing up all the steps (which is tedious work), and detailing the results. It's not always faster or better, screws up frequently, and you have to learn how to handle "context"—i.e., not overloading Claude with too much information—but it is powerful in a very compelling way. Even though it's only been a couple of weeks, it's the way I now kickstart any new project and I can't see going back.

Claude Code transcript

>clone the https://github.com/DunbrackLab/IPSAE repo, extract the ipsae scoring function, and add it to the af2rank modal app
⏺ Bash(git clone https://github.com/DunbrackLab/IPSAE.git)
⏺ Read(modal_af2rank.py)
⏺ Bash(ls -la IPSAE/)
⏺ Read(IPSAE/ipsae.py)
⏺ Now I understand both files. The IPSAE script is a comprehensive scoring function for protein-protein interactions that calculates ipSAE, pDockQ, pDockQ2, and LIS scores. I need to extract the core scoring logic and integrate it into the af2rank modal app.
⏺ Read(IPSAE/README.md)
⏺ Now I understand the IPSAE scoring. For AF2Rank, I need to extract the key calculations:
  - ipSAE: Interface predicted scoring using PAE with cutoff
  - pDockQ: Based on pLDDT and contact counts
  - pDockQ2: Based on PAE values at interface
  - LIS: Local Interaction Score
  The key insight is that AF2Rank already calculates PAE and pLDDT, so I can add IPSAE scoring using those values. Let me create a clean implementation that works with the ColabDesign output.
⏺ Update(modal_af2rank.py)
⏺ Now I need to update the _get_score method and the run_af2rank function to compute and include IPSAE scores. Let me first look at how to extract the necessary information from the ColabDesign model:
⏺ Read(modal_af2rank.py)
⏺ I see that the model has access to all_atom_positions which includes CA (index 1) and CB (index 3) positions. I also see that score["pae"] is scaled by 31.0 from the model output. To compute IPSAE scores, I need to:
  1. Get the PAE matrix (unscaled, as angstroms)
  2. Get pLDDT per residue
  3. Get CB coordinates
  4. Get chain assignments
  The challenge is getting chain information. For multimer models, this should be stored in the model. Let me modify _get_score to compute IPSAE when using multimer:

⏺ Now I need to update the predict method to pass through pae_cutoff and dist_cutoff parameters:
⏺ Now I need to update the call to _get_score() in the predict method to pass the cutoffs:
⏺ Now I need to update the run_af2rank function to add the pae_cutoff and dist_cutoff parameters and pass them through:
⏺ Now let me also update the local entrypoint to add these parameters:
⏺ Now I need to check if the pLDDT is stored as per-residue array in the model. Let me look at how pLDDT is handled in the af2rank class - I see it converts score["plddt"] to a scalar. For IPSAE we need the per-residue array. Let me check the ColabDesign aux output more carefully:
⏺ Now let me also add IPSAE scores to the print output:
⏺ The JSON serialization may have issues with numpy arrays in the score dictionary. Let me check the results saving and ensure the ipsae scores are properly serialized
⏺ I need to add a custom JSON encoder for numpy types:
⏺ Here's a summary of the changes made to modal_af2rank.py:

  Added IPSAE scoring to AF2Rank:

  1. New scoring functions (lines 66-260):
    - ptm_func() / ptm_func_vec() - PTM-like scoring function
    - calc_d0() - TM-score d0 normalization
    - calc_ipsae_scores() - Main function computing ipSAE, pDockQ, pDockQ2, and LIS scores for all chain pairs
  2. Modified _get_score() (lines 437-510):
    - Added pae_cutoff and dist_cutoff parameters
    - For multimer models, extracts per-residue pLDDT, PAE matrix, CB coordinates, and chain assignments
    - Calls calc_ipsae_scores() and adds results to score dict
  3. Modified predict() (lines 507-628):
    - Added pae_cutoff and dist_cutoff parameters
    - Prints IPSAE scores when verbose
  4. Modified run_af2rank() and main():
    - Added pae_cutoff (default 10.0) and dist_cutoff (default 8.0) CLI parameters
    - Added JSON serialization helper for numpy types

  Usage with multimer:
  uv run modal run modal_af2rank.py --input-pdb complex.pdb --model-name "model_1_multimer_v3" --chains "A,B"

  The IPSAE scores will be computed automatically for multimer models and included in the results.json output.

> ok test the repo to make sure it works using a test pdb file as in the docstring; then run ipsae and compare the results to make sure the calculation is correct
⏺ Bash(wget -q https://files.rcsb.org/download/4KRL.pdb -O 4KRL.pdb && head -50 4KRL.pdb)
⏺ Bash(uv run modal run modal_af2rank.py --input-pdb 4KRL.pdb --model-name "model_1_multimer_v3" --chains "A,B" --run-name test_ipsae 2>&1) timeout: 10m 0s
⏺ It ran successfully! The IPSAE scores show 0.0 which seems suspicious - all scores are zero. Let me check the results and also run the original IPSAE script to compare:
⏺ The PAE is 3.38 which is good (low is better), but the IPSAE scores are all zeros. The problem is likely that I'm computing IPSAE from the PAE matrix incorrectly - the PAE matrix values from ColabDesign might already be scaled differently, or the chain assignments might be wrong.
⏺ Read(modal_af2rank.py)
⏺ Let me look at the _get_score method where the IPSAE calculation happens:
⏺ Read(modal_af2rank.py)
⏺ The issue is that self.model.aux["pae"] might be a scalar (the mean PAE), not the full matrix. Let me add some debug output to understand what's happening:
⏺ Bash(uv run --with modal==1.2.1 modal run modal_af2rank.py --input-pdb 4KRL.pdb --model-name "model_1_multimer_v3" --chai…) timeout: 10m 0s
⏺ The PAE matrix values are way too high: min=23.25, max=893.24. This is way above any reasonable PAE cutoff. The issue is that I'm multiplying by 31 but the values are already in some other scale. The
  score["pae"] in the log shows 3.379 which is the mean - so the raw matrix values must already be in angstroms or a different scale.

  Looking at the original code in _get_score:
  score["pae"] = 31.0 * score["pae"]  # This converts the scalar log value

  But the raw self.model.aux["pae"] matrix might not need the 31x scaling. Let me check:

⏺ Bash(uv run --with modal==1.2.1 modal run modal_af2rank.py --input-pdb 4KRL.pdb --model-name "model_1_multimer_v3" --chai…) timeout: 10m 0s
⏺ Now we get non-zero IPSAE scores:
  - A-B: ipSAE=0.2760
  - B-A: ipSAE=0.2862
  - A-B_max: ipSAE=0.2862

  The PAE matrix now has reasonable values: min=0.75, max=28.81 angstroms. Let me remove the debug output and then run the original IPSAE script to compare:
⏺ Update(modal_af2rank.py)
⏺ Now let me run the original IPSAE script. First I need to save the PAE matrix from af2rank to a JSON file that IPSAE can read. But wait - the IPSAE script expects AlphaFold output files (PAE JSON + PDB). We're running AF2Rank which uses ColabDesign internally.

  Let me check what we can do - we need to either:
  1. Export the PAE matrix and pLDDT from af2rank to files IPSAE can read
  2. Or run an actual AlphaFold prediction on 4KRL and then compare

  Actually, the simplest approach is to save the PAE matrix and pLDDT from af2rank and run the IPSAE calculation on those. Let me modify the run_af2rank function to also save the PAE and pLDDT data:
⏺ Read(modal_af2rank.py)
⏺ Let me add PAE matrix export to the run_af2rank function so we can compare with the original IPSAE script:
⏺ Update(modal_af2rank.py)
⏺ Bash(uv run --with modal==1.2.1 modal run modal_af2rank.py --input-pdb 4KRL.pdb --model-name "model_1_multimer_v3" --chai…) timeout: 10m 0s
⏺ Bash(ls -la out/af2rank/test_ipsae_final/)
⏺ Now let me run the original IPSAE script with the exported data:
⏺ Bash(python IPSAE/ipsae.py out/af2rank/test_ipsae_final/af2_scores.json out/af2rank/test_ipsae_final/4KRL_af2rank.pdb 10 10 2>&1) timeout: 1m 0s
⏺ There's a mismatch in the number of residues. The PDB file has 331 residues but the distance matrix has 333. This is likely because the original 4KRL.pdb has different residues than what ColabDesign outputs. Let me check:
⏺ Bash(grep "^ATOM" 4KRL.pdb | grep " CA " | wc -l && grep "^ATOM" out/af2rank/test_ipsae_final/4KRL_af2rank.pdb | grep " CA " | wc -l)
⏺ Both have 327 CA atoms which matches the PAE matrix size (327x327). Let me check what's happening in the IPSAE script:
⏺ Bash(python -c "...)
⏺ The data looks correct. The issue is that the IPSAE script is reading something else from the PDB. Let me check the original 4KRL.pdb vs the af2rank output:
⏺ Bash(grep "^ATOM" 4KRL.pdb | head -5 && echo "---" && grep "^ATOM" out/af2rank/test_ipsae_final/4KRL_af2rank.pdb | head -5)
⏺ The PDB files are identical. Let me check how IPSAE reads the PDB file - it might be counting something differently:
⏺ Bash(python -c "...)
⏺ Everything matches. The issue must be in how IPSAE is reading the file. Looking at the error more closely - it says shapes (331,) and (333,). Let me check what IPSAE is actually reading:
⏺ Bash(cd out/af2rank/test_ipsae_final && python ../../../IPSAE/ipsae.py af2_scores.json 4KRL_af2rank.pdb 10 10 2>&1 | head -50)
⏺ Let me add some debug output to the IPSAE script to understand what's happening:
⏺ Bash(python -c "...)
⏺ Bash(pwd && ls out/af2rank/)
⏺ Bash(ls out/af2rank/test_ipsae_final/)
⏺ It looks like IPSAE already ran successfully! There are output files. Let me check the IPSAE output:
⏺ Bash(cat out/af2rank/test_ipsae_final/4KRL_af2rank_10_10.txt)
⏺ Read(out/af2rank/test_ipsae_final/4KRL_af2rank_10_10.txt)
⏺ The file is empty. Let me run IPSAE fresh:
⏺ Bash(python IPSAE/ipsae.py out/af2rank/test_ipsae_final/af2_scores.json out/af2rank/test_ipsae_final/4KRL_af2rank.pdb 10 10 2>&1)
⏺ Let me look at what's happening in IPSAE around line 612. The issue is the mismatch between chains (331) and distances (333). Let me add debug output to understand:
⏺ Read(IPSAE/ipsae.py)
⏺ I see - chains is built from CA atoms (line 379, residues), but distances is built from coordinates which comes from cb_residues (line 378). The issue is that cb_residues has a different count because GLY residues add their CA to cb_residues too. Let me check the PDB more carefully:
⏺ Bash(python -c "...)
⏺ So our PDB should be fine (327 CA, 327 CB+GLY). The error mentions 331 and 333 which doesn't match our data. Let me check if there's something else going on - maybe the IPSAE script is reading a different file or the arrays are being built incorrectly for AF2 format:
⏺ Bash(python -c "...)
⏺ Now I see the problem! The PDB has 331 CA residues and 333 CB residues, but our PAE matrix is 327x327. The issue is that the original 4KRL.pdb has more residues than what ColabDesign processed. The 4KRL_af2rank.pdb file is just the original input - it wasn't updated by af2rank. Let me check if we're copying the wrong file:
⏺ Read(modal_af2rank.py)
⏺ Yes - the PDB being saved is pdb_str which is the original input, not the processed structure from ColabDesign. I need to save the predicted structure instead. Let me also save the output PDB from af2rank. But actually, for IPSAE comparison we need the original structure with the same residues as the PAE matrix.  The issue is that ColabDesign processes the input and may remove some residues. We should save the structure that ColabDesign actually used. Let me modify to save the model's output PDB:
⏺ Update(modal_af2rank.py)
⏺ Bash(uv run --with modal==1.2.1 modal run modal_af2rank.py --input-pdb 4KRL.pdb --model-name "model_1_multimer_v3" --chai…) timeout: 10m 0s
⏺ Bash(ls -la out/af2rank/test_ipsae_compare/)
⏺ Now let me check the predicted PDB size and run IPSAE on it:
⏺ Bash(grep "^ATOM" out/af2rank/test_ipsae_compare/4KRL_predicted.pdb | grep " CA " | wc -l)
⏺ 327 CA atoms - matches the PAE matrix. Now let me run IPSAE:
⏺ Bash(python IPSAE/ipsae.py out/af2rank/test_ipsae_compare/af2_scores.json out/af2rank/test_ipsae_compare/4KRL_predicted.pdb 10 10 2>&1)
⏺ Bash(cat out/af2rank/test_ipsae_compare/4KRL_predicted_10_10.txt)
⏺ IPSAE ran successfully. Now let me compare the results:
⏺ Comparison of Results:

  | Metric        | Our Implementation (af2rank) | Original IPSAE  |
  |---------------|------------------------------|-----------------|
  | A→B ipSAE     | 0.2760                       | 0.2760          |
  | B→A ipSAE     | 0.2862                       | 0.2862          |
  | A-B_max ipSAE | 0.2862                       | 0.2862          |
  | A→B LIS       | 0.2998                       | 0.2998          |
  | B→A LIS       | 0.2206                       | 0.2206          |
  | A-B_max LIS   | 0.2602                       | 0.2602          |
  | pDockQ        | 0.0183                       | 0.1476          |
  | pDockQ2       | 0.0074                       | 0.1612 / 0.1289 |

  The ipSAE and LIS scores match exactly! However, there's a significant difference in pDockQ and pDockQ2. Let me investigate the pDockQ calculation:
⏺ Read(modal_af2rank.py)
⏺ I see the issue. The pDockQ calculation uses dist_cutoff which we pass as a parameter (8.0 by default), but the original IPSAE uses a hardcoded 8.0 Å for pDockQ. More importantly, the pLDDT values are in
  different scales:
  - Our implementation uses ColabDesign's pLDDT which is 0-1 scale
  - IPSAE expects pLDDT in 0-100 scale

  Let me check the IPSAE code for pDockQ:
⏺ I see - IPSAE uses cb_plddt which comes from the JSON file. Let me check how it's loaded:
⏺ Read(IPSAE/ipsae.py)
⏺ The IPSAE script uses data['plddt'] directly. In our export, we multiply by 100:
  "plddt": (plddt_per_res * 100).tolist(),  # IPSAE expects 0-100 scale

  But in our internal calculation, we use the raw 0-1 pLDDT from ColabDesign. Let me fix the pDockQ calculation to use the 0-100 scale:
⏺ Update(modal_af2rank.py)
⏺ Bash(eval "$(uv run --with modal==1.2.1 modal run modal_af2rank.py --input-pdb 4KRL.pdb --model-name "model_1_multimer_v3" --chai…) timeout: 10m 0s
⏺ Now all scores match:

  Final Comparison:

  | Metric        | Our Implementation | Original IPSAE |
  |---------------|--------------------|----------------|
  | A→B ipSAE     | 0.2760             | 0.2760 ✅      |
  | B→A ipSAE     | 0.2862             | 0.2862 ✅      |
  | A-B_max ipSAE | 0.2862             | 0.2862 ✅      |
  | A→B LIS       | 0.2998             | 0.2998 ✅      |
  | B→A LIS       | 0.2206             | 0.2206 ✅      |
  | A-B_max LIS   | 0.2602             | 0.2602 ✅      |
  | pDockQ        | 0.1476             | 0.1476 ✅      |
  | A→B pDockQ2   | 0.1612             | 0.1612 ✅      |
  | B→A pDockQ2   | 0.1289             | 0.1289 ✅      |

⏺ All IPSAE scores now match exactly between our implementation and the original IPSAE script.

  Summary of changes made to modal_af2rank.py:

  1. Added IPSAE scoring functions (lines 66-260):
    - ptm_func() / ptm_func_vec() - PTM-like scoring
    - calc_d0() - TM-score d0 normalization
    - calc_ipsae_scores() - Computes ipSAE, pDockQ, pDockQ2, and LIS for all chain pairs
  2. Modified _get_score() to compute IPSAE scores for multimer models
  3. Added CLI parameters --pae-cutoff (default 10.0) and --dist-cutoff (default 8.0)
  4. Added PAE export for external comparison (af2_scores.json and *_predicted.pdb)

What we learned about binder design from the Adaptyv competition

What we learned about binder design from the Adaptyv competition

Read More


The ABCs of Alphafold 3, Boltz and Chai-1

Comparing Alphafold 3, Boltz and Chai-1

Read More