Normal-looking distributions and maximum entropy
from scipy import stats
import numpy as np
import matplotlib.pyplot as plt
from matplotlib import animation, rc
from IPython.display import HTML, Image

rc('animation', html='html5')
plt.style.use('ggplot')
%matplotlib inline
%config InlineBackend.figure_format = 'retina'
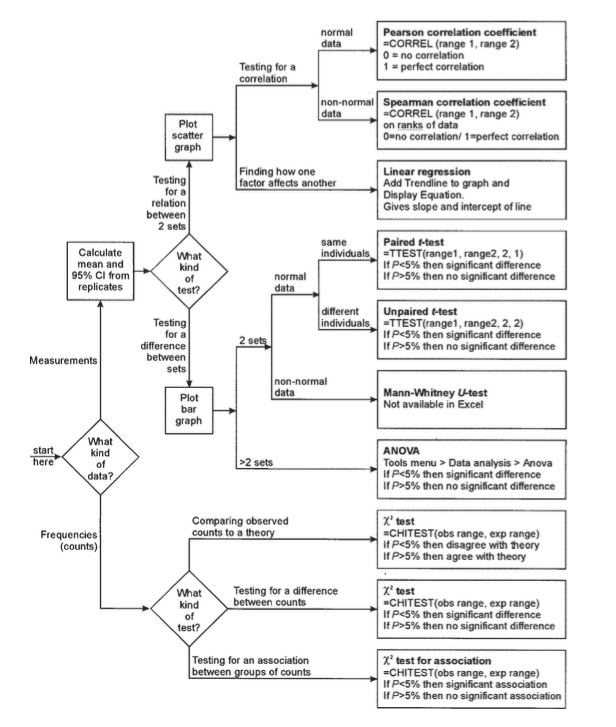
Like many scientists, I've always been confused by and uncomfortable with the menagerie of available statistical tests, how they relate, and when to use them ("use a Chi-square test, unless n<5..."). It's hard to recover the logic underlying diagrams like the one below. Many of these tests rely on the data "being normal", but why? And how normal do they have to be?
Normal-looking distributions
As we learn, the normal — or Gaussian — results from the central limit theorem, when you add together random samples from the same distribution. There are some conditions, like the samples must be independent and the distribution must have finite variance.
If we know the underlying process producing the samples meets these conditions, then we can use the normal distribution with confidence. We also learn that even if the above conditions are not met, it's probably ok to just use the normal anyway (e.g., multipying values instead of adding, samples not from the same distribution), or we can apply a transformation to make the distribution "look normal". Then once we have a normal-looking distribution, we can use a standard $t$-test, etc. To many of us, this is not a hugely satisfying way to apply statistics, and it definitely does not feel very scientific.
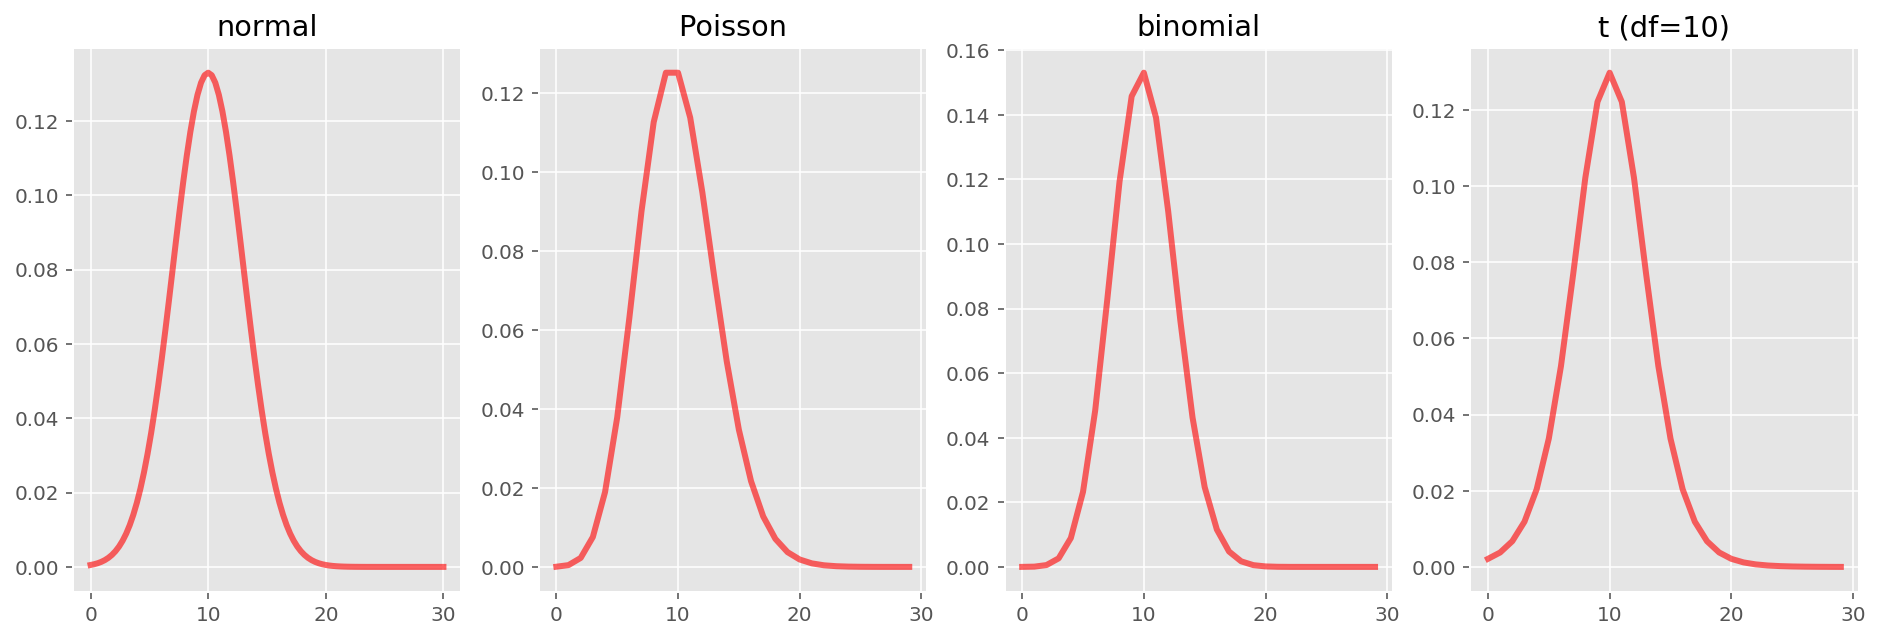
Additionally, the normal doesn't seem particularly differentiated from other distributions. The binomial, Poisson, normal and t-distributions all look very similar... In fact, they can look very very similar, as we can see below. (Of course, the first three are members of the exponential family, so they are not unrelated, but I'll leave that aside.)
fig, ax = plt.subplots(1, 4, figsize=(16,5))

x = np.linspace(0, 30, 100)
ax[0].set_title("normal")
_ = ax[0].plot(x, stats.norm(10, 3).pdf(x), 'r-', lw=3, alpha=0.6)

x = np.arange(30)
ax[1].set_title("Poisson")
_ = ax[1].plot(x, stats.poisson(10).pmf(x), 'r-', lw=3, alpha=0.6)

x = np.arange(30)
ax[2].set_title("binomial")
_ = ax[2].plot(x, stats.binom(30, 1/3).pmf(x), 'r-', lw=3, alpha=0.6)

x = np.arange(30)
ax[3].set_title("t (df=10)")
_ = ax[3].plot(x, stats.t(10, 10, 3).pdf(x), 'r-', lw=3, alpha=0.6)
It turns out that these distributions are indeed all closely related, and you can derive them and understand how they are related using relatively simple (high school-ish level) maths. The trick is that you have to use the principle of "maximum entropy".
What is entropy?
I won't attempt to define entropy rigorously, since I am not a statistician and definitions are fiddly things, but I think it suffices to think of a maximum entropy distribution as the smoothest, most even distribution that still fits with some constraints. In other words, the distribution should not prefer any value in particular unless forced to do so to meet its constraints.
In the simplest example, the maximum entropy distribution bounded by two finite values is just a flat (uniform) distribution (the "principle of indifference").
You can calculate the entropy of a distribution using $H(X) = -\sum_{k\geq1}p_k log(p_k)$; or for continuous distributions: $H(X) = -\int_{-\infty}^{\infty}p(x) \log p(x)dx$. The concept of entropy is fundamental across several fields including information theory and statistical mechanics, so these formulas may look familiar.
Because we can measure the entropy of any distribution, we can define some constraints (e.g., a distribution has bounds 0 to 1, the mean is $\mu$, etc), and derive the maximum entropy distribution given those constraints, using differentiation to find the maximum and Lagrange multipliers to enforce the constraints.
For a proper description and derivation, see Data Analysis, A Bayesian Tutorial by Sivia & Skilling (Section 5.3). That is where I first learned about this, and it is still the best treatment I have seen. Statistical Rethinking by McElreath (Section 9.1) also discusses this topic; Information Theory by MacKay (Section 22.13) (a free book) discusses it in passing, and I'm sure a lot of other books do too.
I will just give the gist, but hopefully it's near enough correct.
Deriving the normal distribution
To derive the normal distribution, we start with this formula (Sivia & Skilling, Section 5.3.2):

It looks complicated, but it's really just the entropy formula with two Lagrange multipliers (and three constraints): the sum of $p$'s is $1$ (because it's a probability distribution), the mean is $\mu$, and the variance is $\sigma^2$. If we take the derivative to find the maximum entropy — by setting ${\partial}Q/{\partial}p = 0$ — out pops the normal distribution in just a couple of steps (see the book for details!)
So, the normal distribution is the "fewest-assumptions" distribution there is if you have only a mean and a variance, and that is partially why it's so broadly applicable! That also explains (I think) why it's generally ok to use the normal distribution even when its conditions (i.i.d. samples, finite variance, etc) have not been met. It's about as general a distribution as you can get.
Other distributions
Sivia derives a few other fundamental distributions using maximum entropy:
- Exponential: this is derived identically to the normal, but with no variance constraint (just the mean).
- Binomial: this is derived using similar methods, but starting with the formula for ${n \choose k}$.
- Poisson: this is derived similarly to the binomial, though it also requires a Taylor expansion.
Sivia also draws some interesting connections between the distributions:
- The binomial can be approximated by the Poisson, for large $N$ and small $p$.
- The Poisson can be approximated by the normal, for large $\mu$, using Stirling's approximation.
I think this sums up pretty nicely how these common distributions are related and why they all look so similar.
Which distributions correspond to which constraints?
There is a nice wikipedia article on maximum entropy probability distributions, with a table of twenty or so distributions and the associated constraints (below are just a subset):

Interestingly, sometimes apparently simple constraints (e.g., bounds are $a$ to $b$, mean is $\mu$) can produce complicated answers.
The fat-tailed $t$-distribution
The $t$-distribution, of $t$-test fame, is not covered in the above section of Sivia & Skilling, though it can be derived using maximum entropy too. One description of the $t$-distribution that shows its connection to the normal is that it represents samples from a normal distribution of uncertain variance (hence its common description as "like the normal distribution with fatter tails"). As the number of degrees of freedom grows, the $t$-distribution approaches the normal distribution. At $\geq10$ degrees of freedom, the $t$ and normal distributions are difficult to distinguish (see my plots at the start of this post).
Another interesting thing about the $t$-distribution versus the normal is that MacKay claims that the normal distribution is not really a good "real world" distribution, since its tails are too light (Information Theory, Section 23.2). For example, fatter tails are more forgiving to outliers, and the natural world has a lot of outliers: height is almost the canonical example of a normally distributed trait, but dwarfism and gigantism produce heights more standard deviations from the mean than a normal distribution expects.
For any natural data, it might actually be better overall to use a $t$-distribution or other fatter tailed distribution. Of course, that makes it more difficult to solve Ordinary Least Squares and so on, but we have powerful computers now that can solve these things numerically, so maybe it should not matter? Similarly, when choosing priors, experts will often recommend fatter tailed distributions, like the $t$-distribution or the related half-Cauchy over the normal, especially for scale parameters (e.g., standard deviation).
Conclusion
Many of the common distributions we come across in science can be understood from the perspective of deriving the maximum entropy distribution subject to some constraints. Relatedly, some of the most fundamental distributions can be understood as approximations of each other under different conditions. This perspective on probability distributions was not at all obvious to me for a long time, but I wish probability and statistics were taught more in this style instead of the "cookbook" style.
With the growth in probabilistic programming (Stan, PyMC3, Edward), sometimes replacing standard statistical tests, it is becoming more important to think about which distributions really represent your data and why. It's not always normal.
Appendix
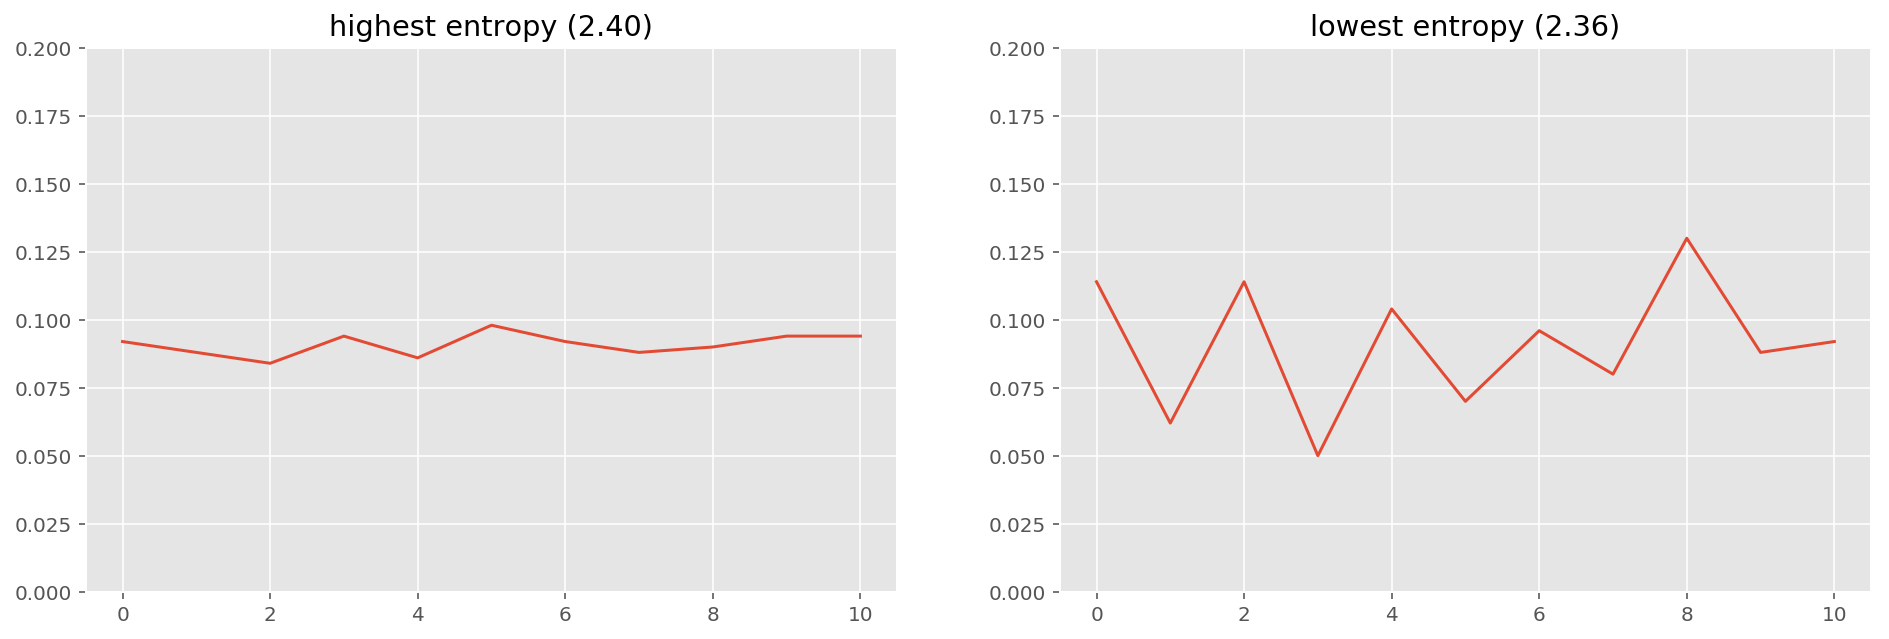
It's not so difficult to prove that the maximum entropy distribution is uniform. Nevertheless here's a simulation. The highest entropy distribution from this simulation looks uniform, and the lowest entropy distribution looks very skewed.
min_ent, max_ent = np.inf, -np.inf
N = 11

for _ in range(10000):
    vals = np.zeros(N)
    for _ in range(500):
        vals[np.random.randint(N)] += 1
    vals /= sum(vals)

    ent = (-vals*np.log(vals)).sum()

    if ent > max_ent:
        max_vals = vals[:]
        max_ent = ent
    if ent < min_ent:
        min_vals = vals[:]
        min_ent = ent

fig, ax = plt.subplots(1, 2, figsize=(16,5))
ax[0].set_ylim([0, .2])
ax[1].set_ylim([0, .2])
ax[0].set_title("highest entropy ({:.2f})".format(max_ent))
ax[1].set_title("lowest entropy ({:.2f})".format(min_ent))

x = np.linspace(0, 10, N)
_ = ax[0].plot(x, max_vals)
_ = ax[1].plot(x, min_vals)
The beta distribution is also a maximum entropy distribution bounded by 0 and 1. It also starts to look pretty normal after a few samples. (Thanks to the louistao.me blog for instructions on how to animate it).
ps = np.linspace(0, 1, 101)
n_start, k_start = 0, 0

def animate(i):
    if i > 90:   j = 0
    elif i > 50: j = 90 - i
    elif i > 40: j = 40
    else:        j = i

    n = j*2 + n_start
    k = j + k_start

    y = (ps**k)*((1-ps)**(n-k))
    y /= max(y)
    line.set_data(ps, y)
    line.set_label("heads:{:2d} flips:{:2d}".format(j,n))
    legend = plt.legend(prop={'family': 'monospace'})
    return (line,)

def init():
    line.set_data([], [])
    return (line,)

fig, ax = plt.subplots(figsize=(8,4))
ax.set_xlim((0, 1))
ax.set_ylim((0, 1.15))
line, = ax.plot([], [], lw=2)
anim = animation.FuncAnimation(fig, animate, init_func=init, frames=100, interval=100, blit=True)
anim